Fig. B.13
Download original image
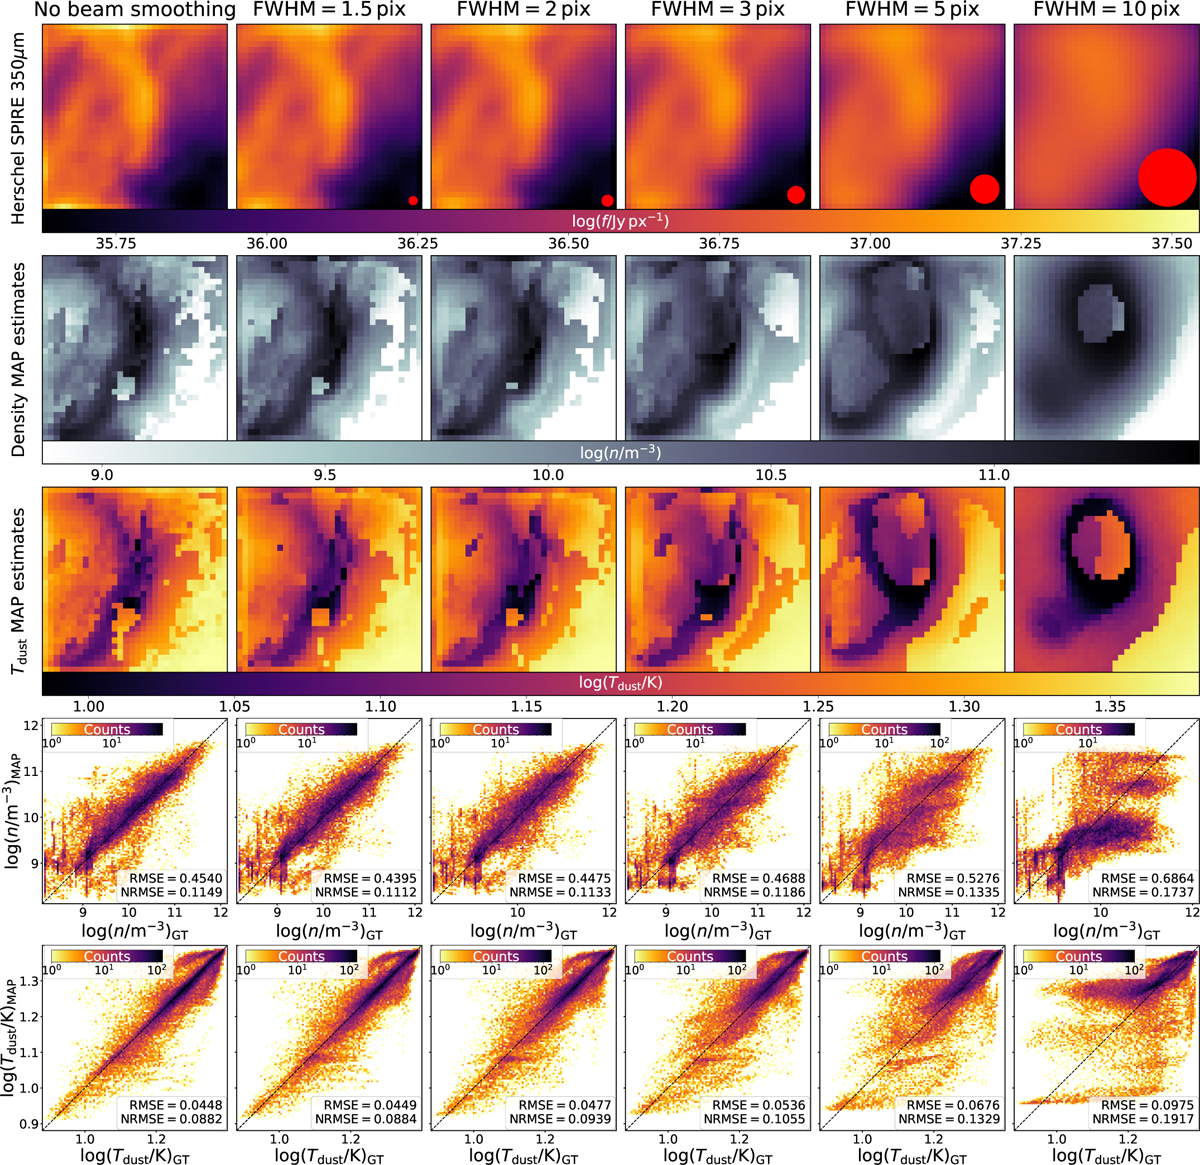
Comparison of prediction results with the seven wavelength SLoS-cINN fordifferent amounts of smoothing applied to the inputobservations at all wavelengths equally. The top row shows the emission maps at the central wavelength of the Herschel SPIRE 350 µm filter as a an example to illustrate the effect of the convolution with a Gaussian beam. The red circle in each of these panels indicates the FWHM of the respective Gaussian kernel. The second and third row show the corresponding MAP estimates for dust density and temperature, respectively, for one example slice of the same cube analysed throughout the paper (i.e. the same slice as in Figures 3, B.3, B.10). The fourth and the fifth rows present a 2D histogram that directly compares the ground truth to the predicted density and temperature MAP estimates, respectively, for all pixels of this test cube, summarising the predictive performance.
Current usage metrics show cumulative count of Article Views (full-text article views including HTML views, PDF and ePub downloads, according to the available data) and Abstracts Views on Vision4Press platform.
Data correspond to usage on the plateform after 2015. The current usage metrics is available 48-96 hours after online publication and is updated daily on week days.
Initial download of the metrics may take a while.