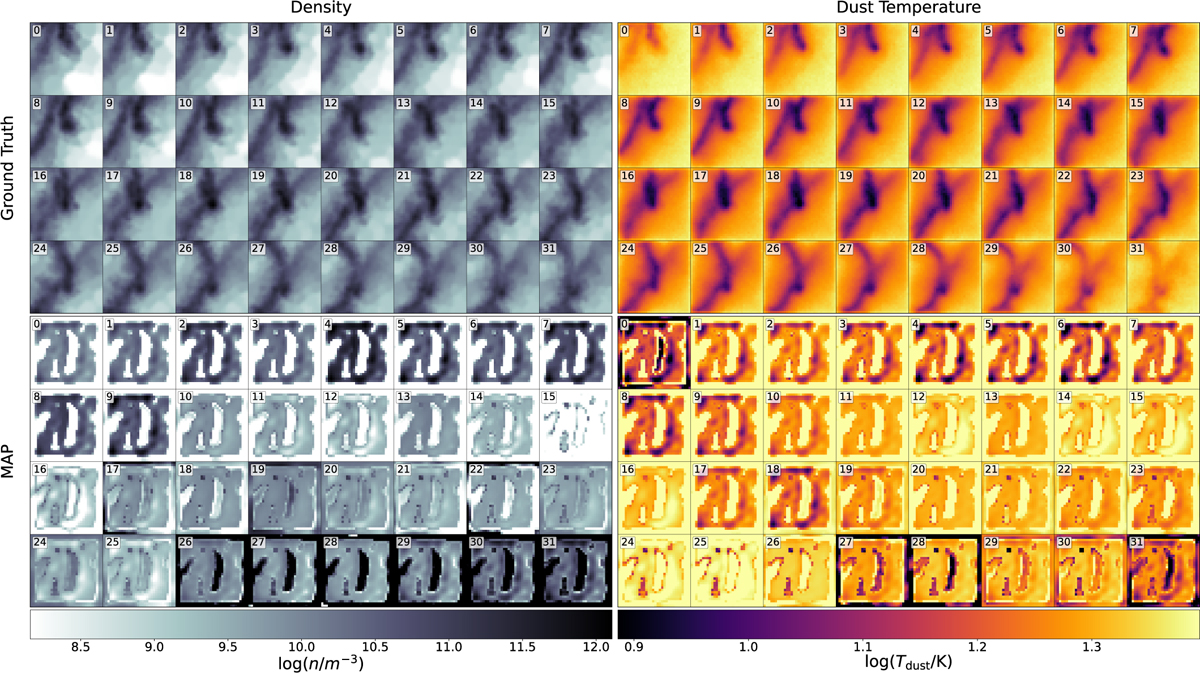
Fig. B.12
Download original image
Comparison of the seven wavelength SLoS-cINN MAP prediction result to the ground truth for one example cube that is only subject to the ISRF. Same cube as in Figure B.8 is shown, with the difference being that here the input dust emission maps were first convolved with the PSFs of the respective instruments, corresponding to the input shown in the bottom row in Figure B.11.
Current usage metrics show cumulative count of Article Views (full-text article views including HTML views, PDF and ePub downloads, according to the available data) and Abstracts Views on Vision4Press platform.
Data correspond to usage on the plateform after 2015. The current usage metrics is available 48-96 hours after online publication and is updated daily on week days.
Initial download of the metrics may take a while.