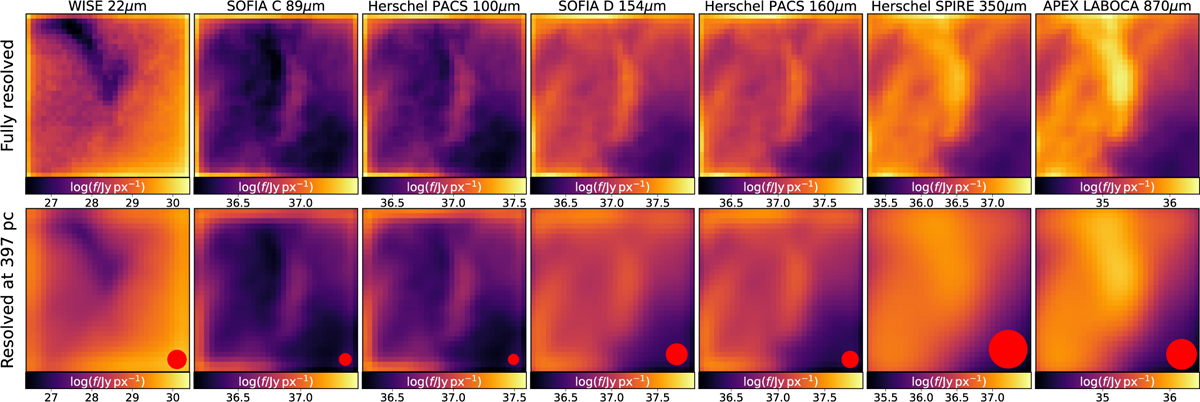
Fig. B.11
Download original image
Comparison of dust emission maps between the perfect resolution scenario and a case that accounts for the PSFs of the respective instruments for the limited filter configuration used in Section 4.3. The red circle in the bottom row panels indicates the FWHM of the respective PSFs. We note that this example is based on the assumption that all considered telescopes share the same pixel size, matching our simulation resolution at a query distance of d = 397 pc.
Current usage metrics show cumulative count of Article Views (full-text article views including HTML views, PDF and ePub downloads, according to the available data) and Abstracts Views on Vision4Press platform.
Data correspond to usage on the plateform after 2015. The current usage metrics is available 48-96 hours after online publication and is updated daily on week days.
Initial download of the metrics may take a while.