Fig. 2
Download original image
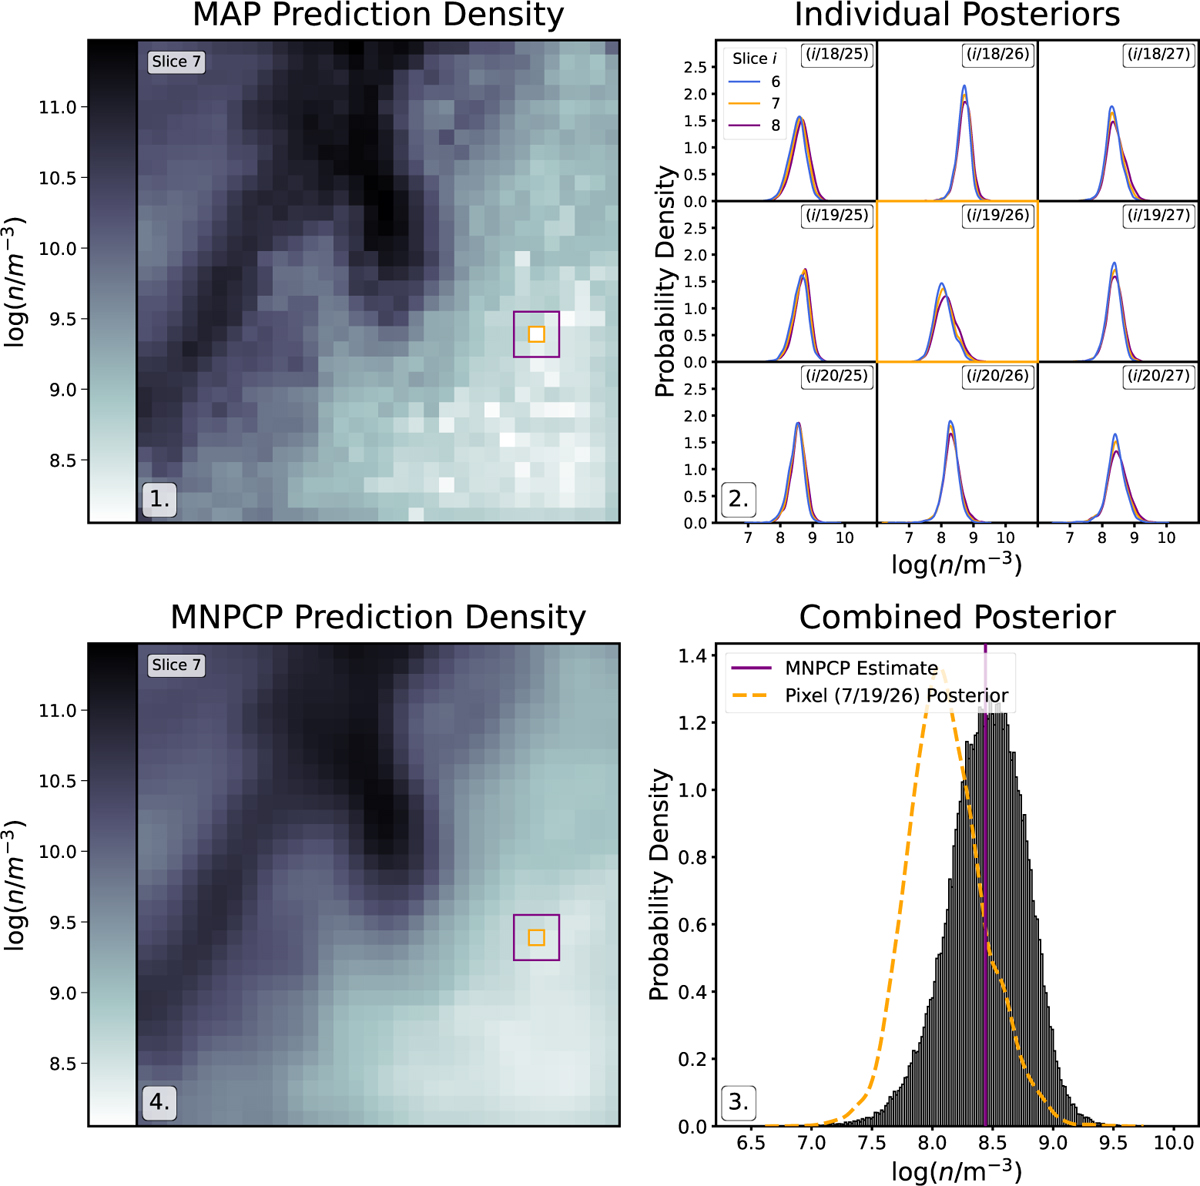
Schematic outline of the median neighbour pixel combined posterior approach for point estimations based on the example of dust density. The procedure follows the panels from top left to bottom left in clockwise order. The top-left panel shows the MAP density estimates for a single slice of a dust cube (perpendicular to the LoS), highlighting the discontinuities that can occur in the MAP estimate. The query pixel, for which the MNPCP estimate will be computed, and its neighbourhood are indicated in orange and purple, respectively. The top-right panel shows the predicted posterior distributions for the dust density for the query pixel with index 7/11/8 (center subpanel indicated by the orange outline) and all 26 neighbouring pixels. The colours of the curves indicate the slice, i, that they come from, whereas the indices in the top right corner denote the pixel index perpendicular to the LoS. The bottom-right panel shows a histogram of the all posterior samples accumulated from the query pixel and its neighbours. Here, the orange dotted curve indicates the original (marginalised 1D) posterior distribution of the query pixel and the purple line marks the MNPCP estimate, which is the city-block distance weighted median of all posterior samples (the distance in pixels when allowing only right angle moves, no diagonals). Finally, the bottom-left panel presents the MNPCP dust density estimates of the slice shown in the top left with the orange and purple boxes indicating again the query pixel and its neighbourhood.
Current usage metrics show cumulative count of Article Views (full-text article views including HTML views, PDF and ePub downloads, according to the available data) and Abstracts Views on Vision4Press platform.
Data correspond to usage on the plateform after 2015. The current usage metrics is available 48-96 hours after online publication and is updated daily on week days.
Initial download of the metrics may take a while.