Fig. B.5
Download original image
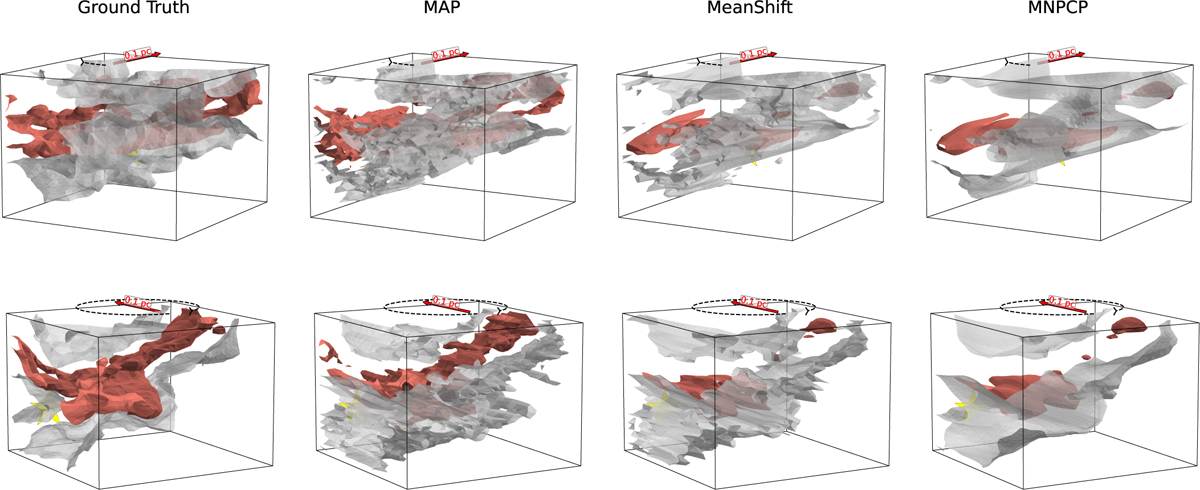
3D isodensity surface diagrams for one example test cube in the ISRF + star radiation configuration, comparing the SLoS-cINN prediction results to the ground truth. Here the two rows show different rotation angles of the given cube. The grey surfaces indicate a density of 1010 m−3, whereas red surfaces mark the 1011 m−3 density level. The yellow star indicates the position of the B4 anaologue placed inside the cube.
Current usage metrics show cumulative count of Article Views (full-text article views including HTML views, PDF and ePub downloads, according to the available data) and Abstracts Views on Vision4Press platform.
Data correspond to usage on the plateform after 2015. The current usage metrics is available 48-96 hours after online publication and is updated daily on week days.
Initial download of the metrics may take a while.