Fig. B.1
Download original image
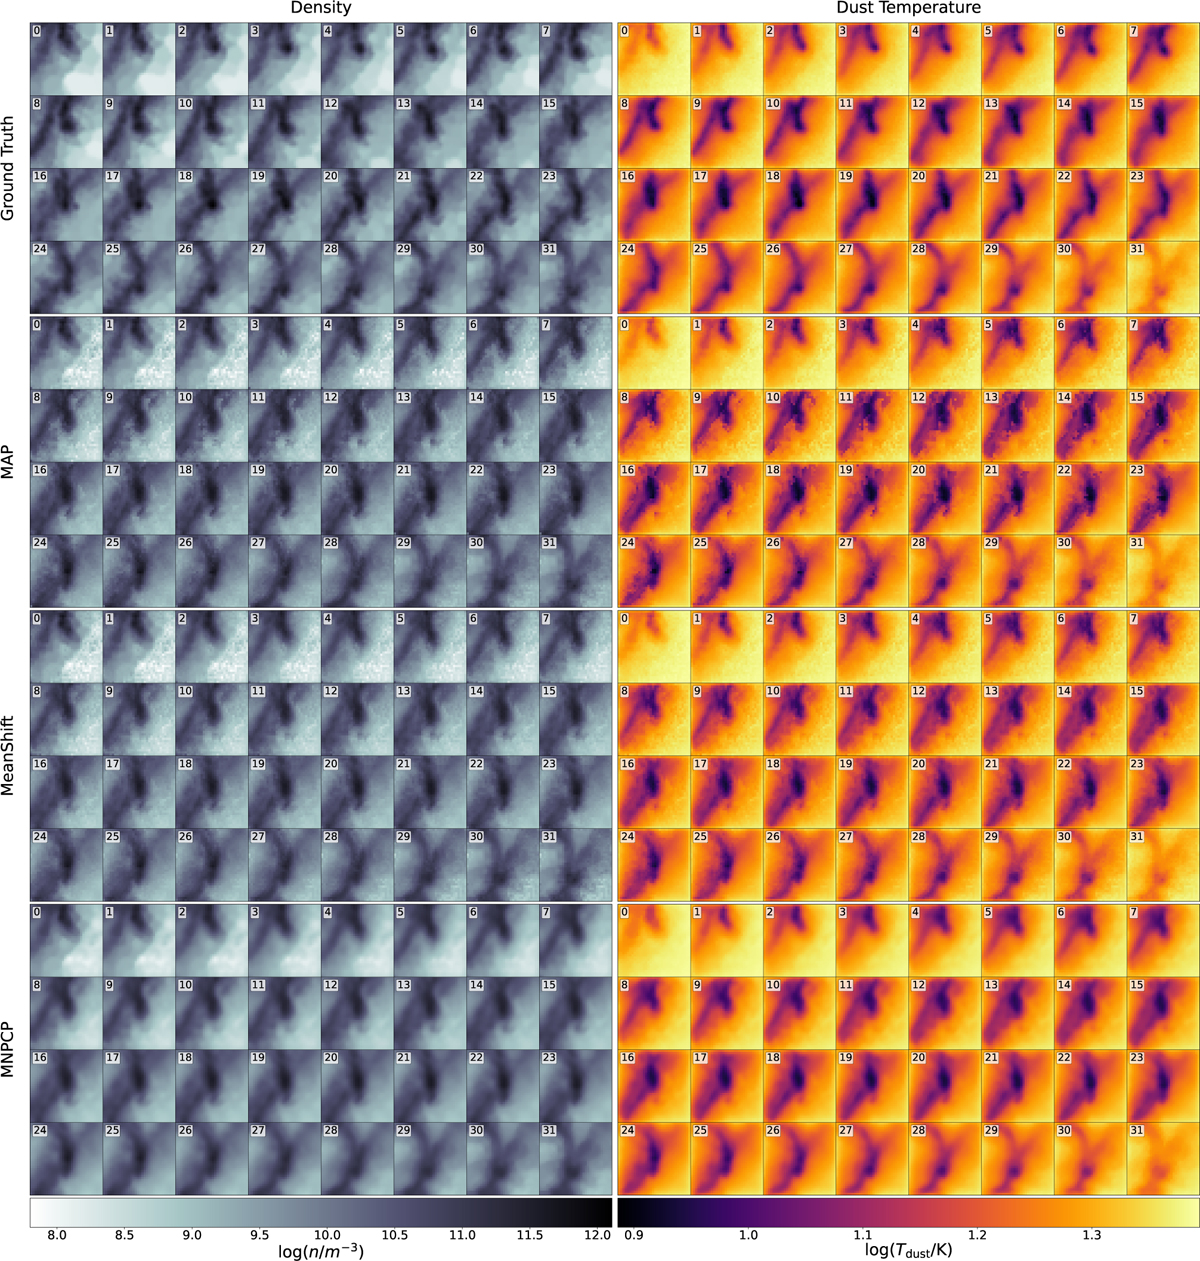
Comparison of the point estimate prediction results to the ground truth for all slices of one example cube that is only subject to the ISRF. In each panel, the subpanels show from top left to bottom right the cube slices going along the LoS from front to back. The left and right columns show the dust density and dust temperature respectively. From top to bottom, the rows indicate the ground truth and the MAP, MeanShift, and MNPCP estimates based on the outcome of the single LoS cINN using all 23 wavelengths. This diagram shows the full cube of the single slices shown in the first two rows of Figure 3.
Current usage metrics show cumulative count of Article Views (full-text article views including HTML views, PDF and ePub downloads, according to the available data) and Abstracts Views on Vision4Press platform.
Data correspond to usage on the plateform after 2015. The current usage metrics is available 48-96 hours after online publication and is updated daily on week days.
Initial download of the metrics may take a while.