Fig. A.3
Download original image
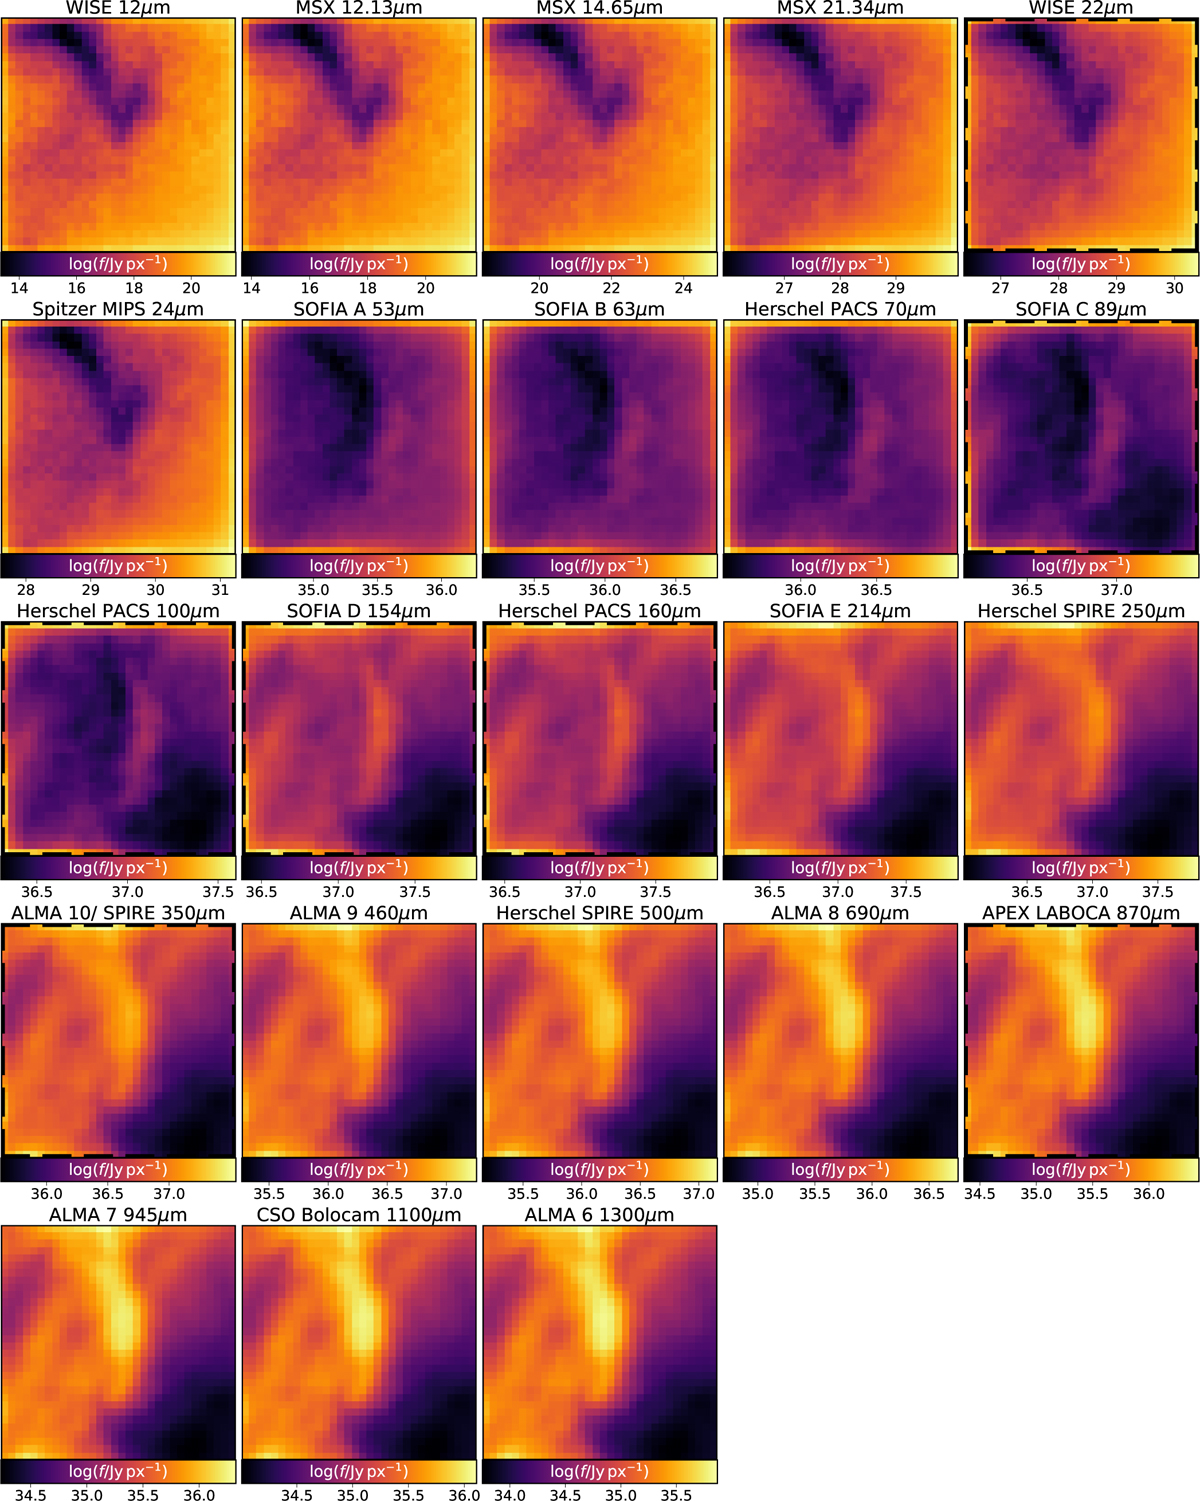
Example of the synthetic dust emission maps at all 23 considered wavelengths that serve as the input to our cINN approach. These correspond to bands of specific instruments (as labelled on the top of each panel), but do not account for PSF-related resolution effects of the respective telescopes. The shown example corresponds to the example cube in the ISRF-only configuration that is also the subject of Figures 3, B.1, and B.2. The panels outlined with the black dashed lines correspond to the seven wavelengths considered in our more limited experiment in Section 4.3. We emphasise that the presented flux maps are corrected for distance.
Current usage metrics show cumulative count of Article Views (full-text article views including HTML views, PDF and ePub downloads, according to the available data) and Abstracts Views on Vision4Press platform.
Data correspond to usage on the plateform after 2015. The current usage metrics is available 48-96 hours after online publication and is updated daily on week days.
Initial download of the metrics may take a while.