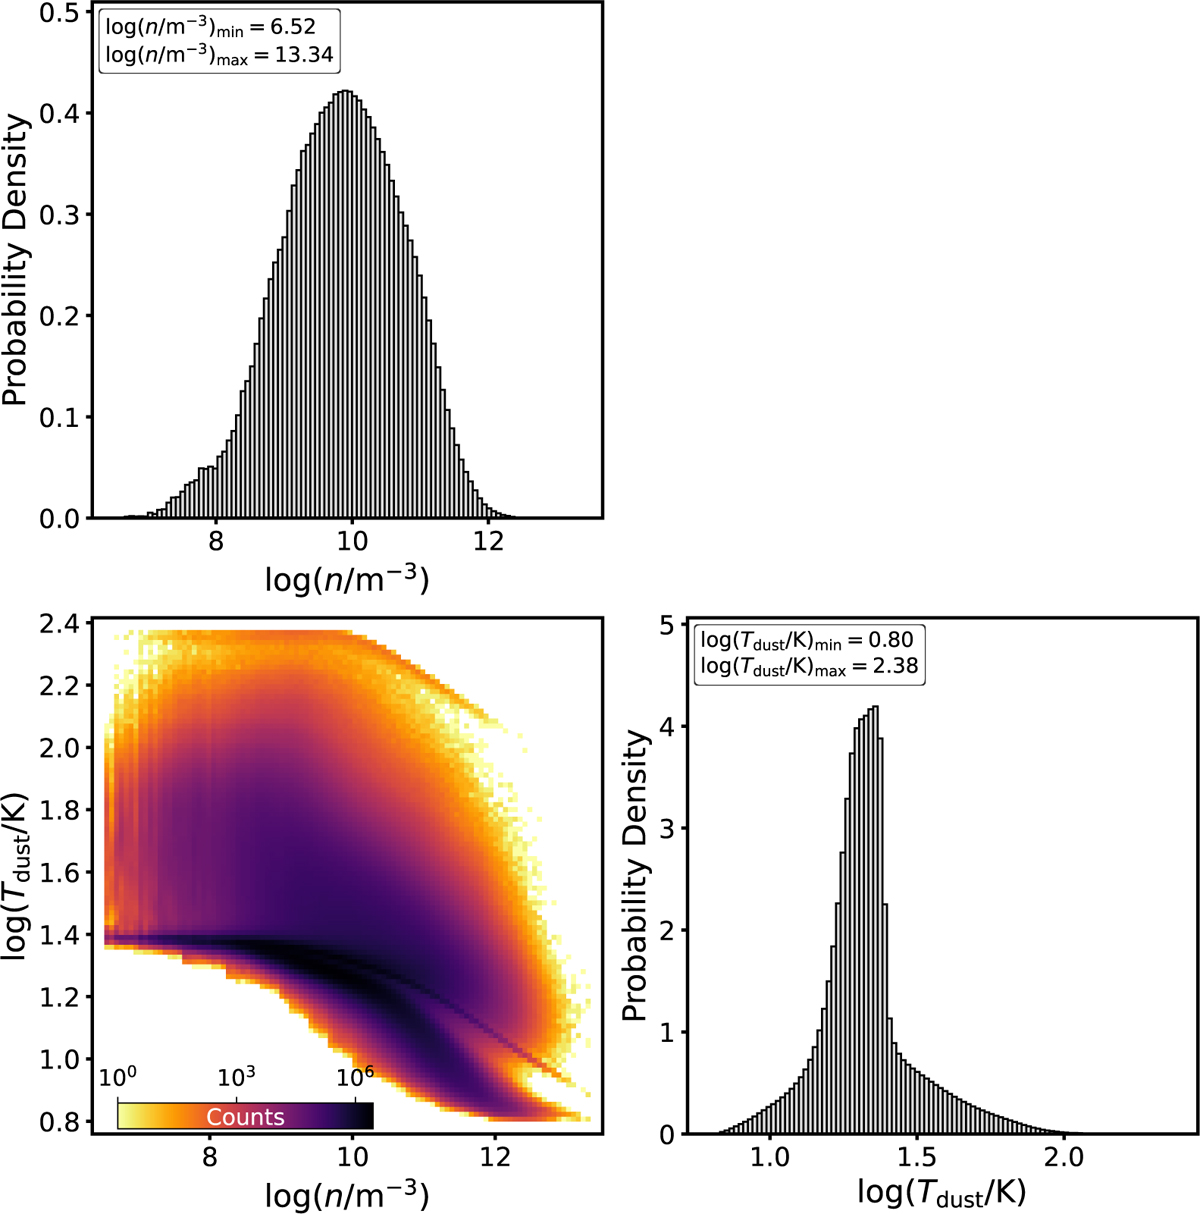
Fig. A.1
Download original image
Histograms of the prior distributions and correlation of the target parameters in the training data over all pixels. The top-left and bottom-right panels show the 1D distributions of the number density and dust temperature, respectively. In both panels, the boxes at the top left provide the minimum and maximum of the respective parameter. The bottom left panel presents a 2D histogram of the effective prior distribution in the combined density-temperature space.
Current usage metrics show cumulative count of Article Views (full-text article views including HTML views, PDF and ePub downloads, according to the available data) and Abstracts Views on Vision4Press platform.
Data correspond to usage on the plateform after 2015. The current usage metrics is available 48-96 hours after online publication and is updated daily on week days.
Initial download of the metrics may take a while.