Fig. 1
Download original image
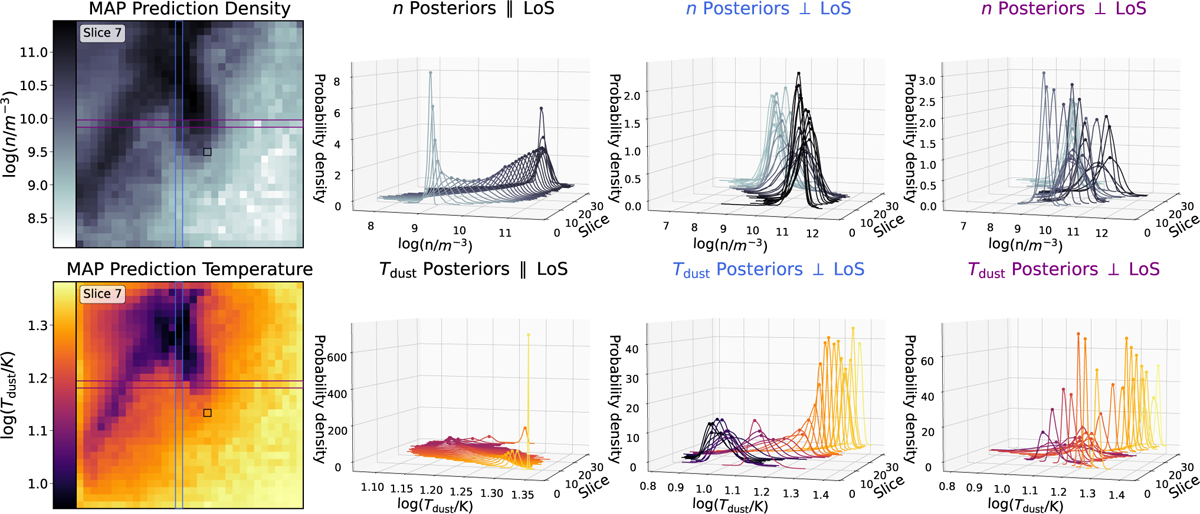
Comparison of the predicted posterior distributions along vs. perpendicular to the LoS (into the plane). The left column shows an example slice with the MAP estimates for dust density (top) and dust temperature (bottom). The other three columns show the posterior distributions of dust density (top) and temperature (bottom) for the lines indicated in the left panels in black, blue and purple, respectively. Here, the black square denotes a LoS going into the plane of the image, whereas the blue and purple lines are perpendicular to the LoS along the x and y axis, respectively.
Current usage metrics show cumulative count of Article Views (full-text article views including HTML views, PDF and ePub downloads, according to the available data) and Abstracts Views on Vision4Press platform.
Data correspond to usage on the plateform after 2015. The current usage metrics is available 48-96 hours after online publication and is updated daily on week days.
Initial download of the metrics may take a while.