Fig. 7.
Download original image
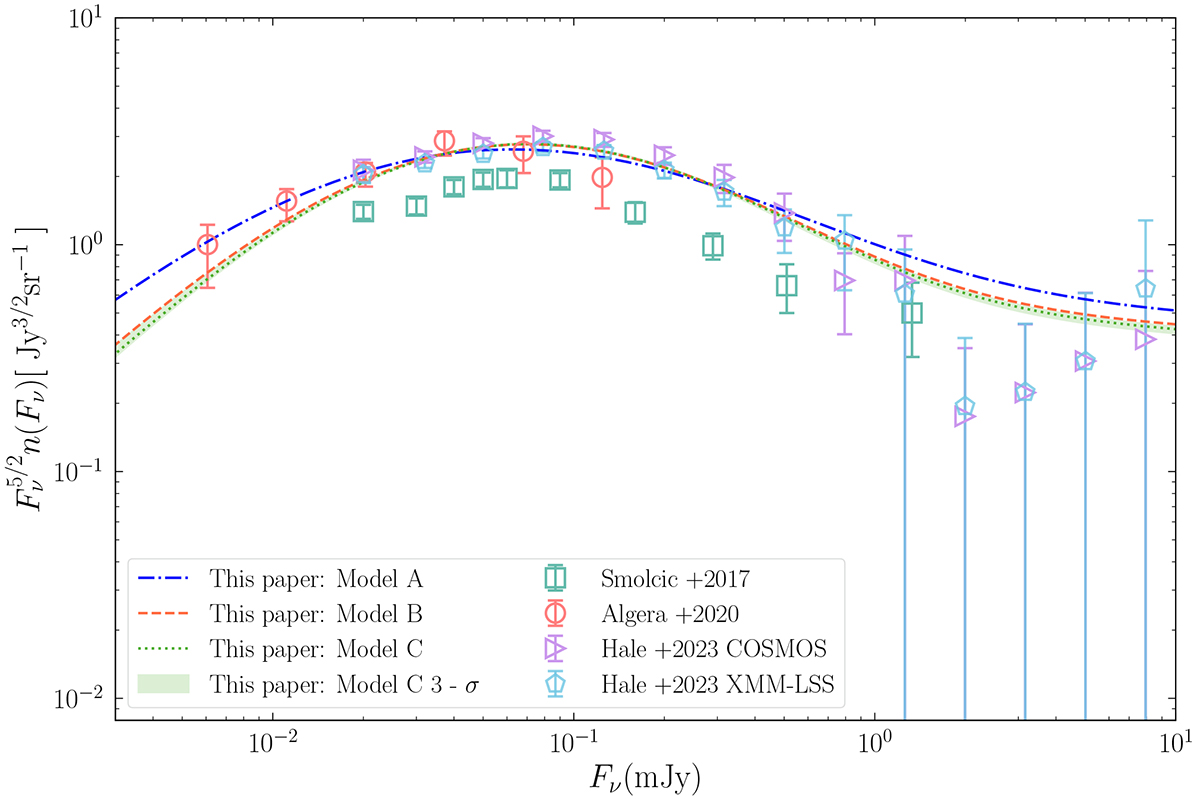
Comparison of our best-fit models with the Euclidean normalized 1.4 GHz source counts for SFGs observed in the literature. The blue dash-dotted line, orange dashed line, and green dotted line show our best-fit source counts of Models A–C, respectively. The source counts from Hale et al. (2023) in the COSMOS and XMM-LSS fields are shown as purple right triangles and light blue pentagons, respectively. Also shown are the observed source counts from Smolčić et al. (2017a, green squares), Algera et al. (2020a, orange circles).
Current usage metrics show cumulative count of Article Views (full-text article views including HTML views, PDF and ePub downloads, according to the available data) and Abstracts Views on Vision4Press platform.
Data correspond to usage on the plateform after 2015. The current usage metrics is available 48-96 hours after online publication and is updated daily on week days.
Initial download of the metrics may take a while.