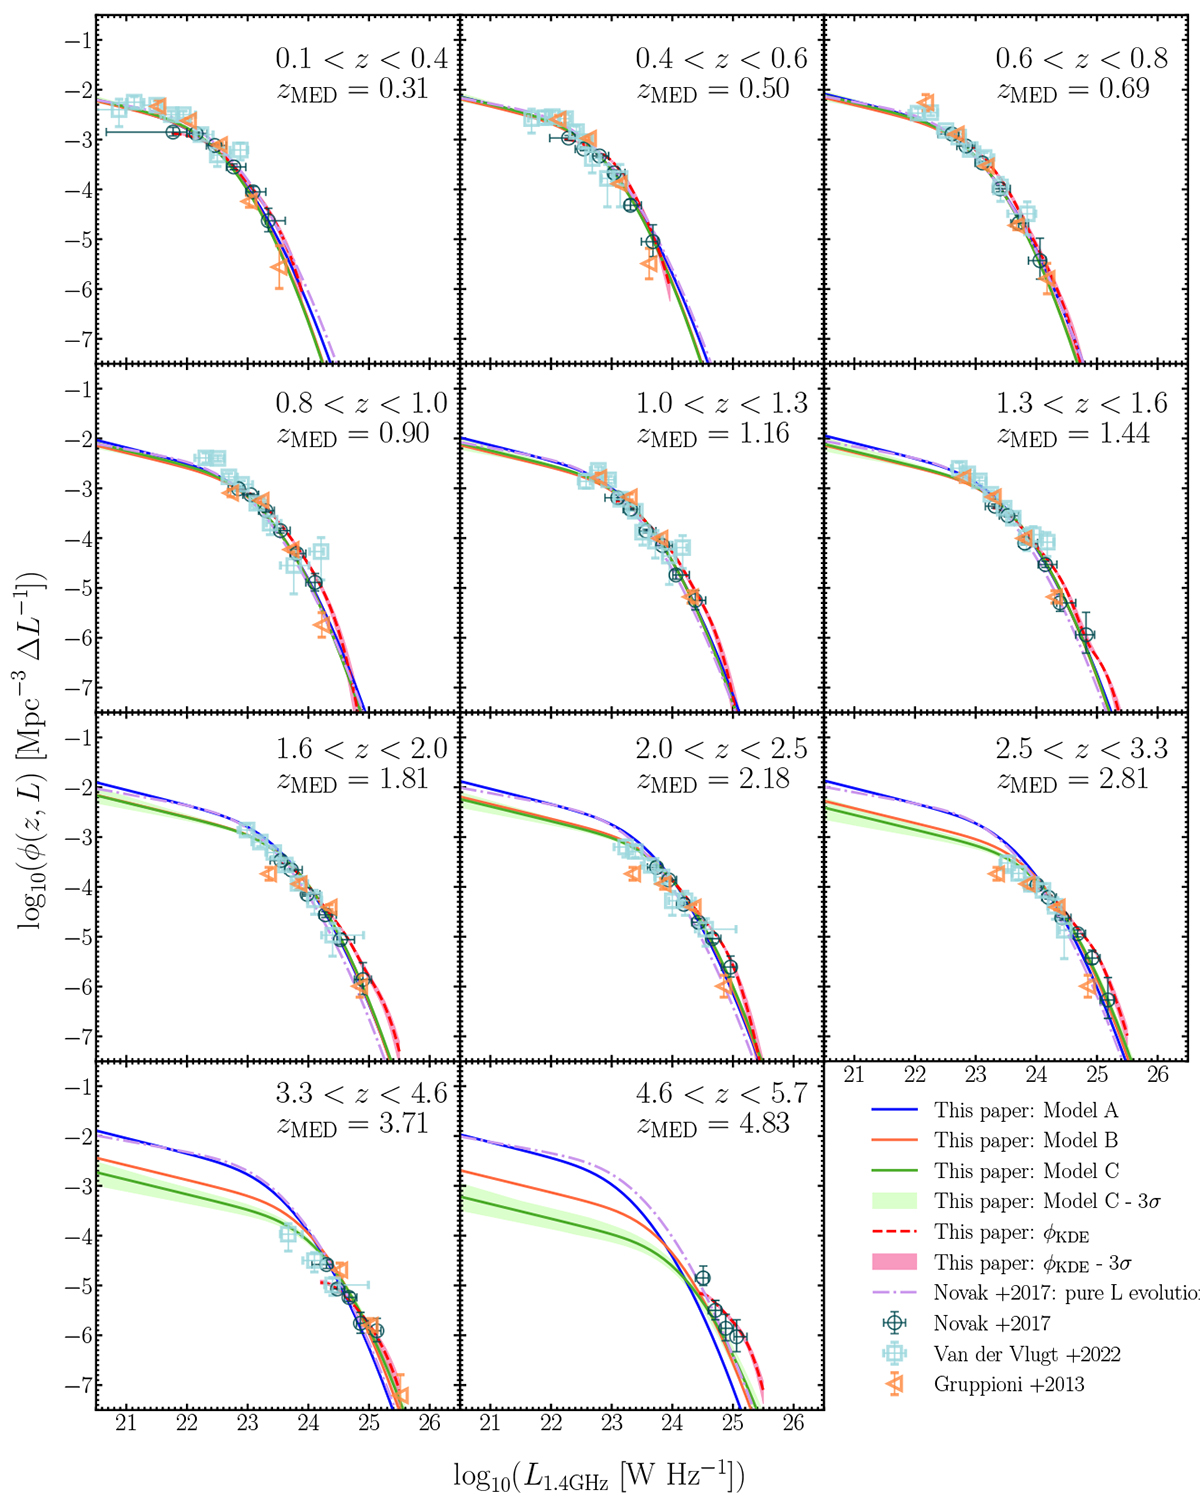
Fig. 6.
Download original image
Radio LFs of SFGs at various redshifts compared with the previous estimates specified in the inset. The best-fit LFs for Models A–C in each redshift bin are shown by the blue, orange, and green solid lines, respectively. The light green shaded area shows the 3σ confidence interval for Model C. The red dashed curves represent the KDE LFs (see Appendix A), with the 3σ confidence interval shown by the pink shaded area. The purple dash-dotted line depicts the PLE model of Novak et al. (2017). We also compare with the binned LFs from Gruppioni et al. (2013), Novak et al. (2017), and van der Vlugt et al. (2022).
Current usage metrics show cumulative count of Article Views (full-text article views including HTML views, PDF and ePub downloads, according to the available data) and Abstracts Views on Vision4Press platform.
Data correspond to usage on the plateform after 2015. The current usage metrics is available 48-96 hours after online publication and is updated daily on week days.
Initial download of the metrics may take a while.