Open Access
Fig. A.1.
Download original image
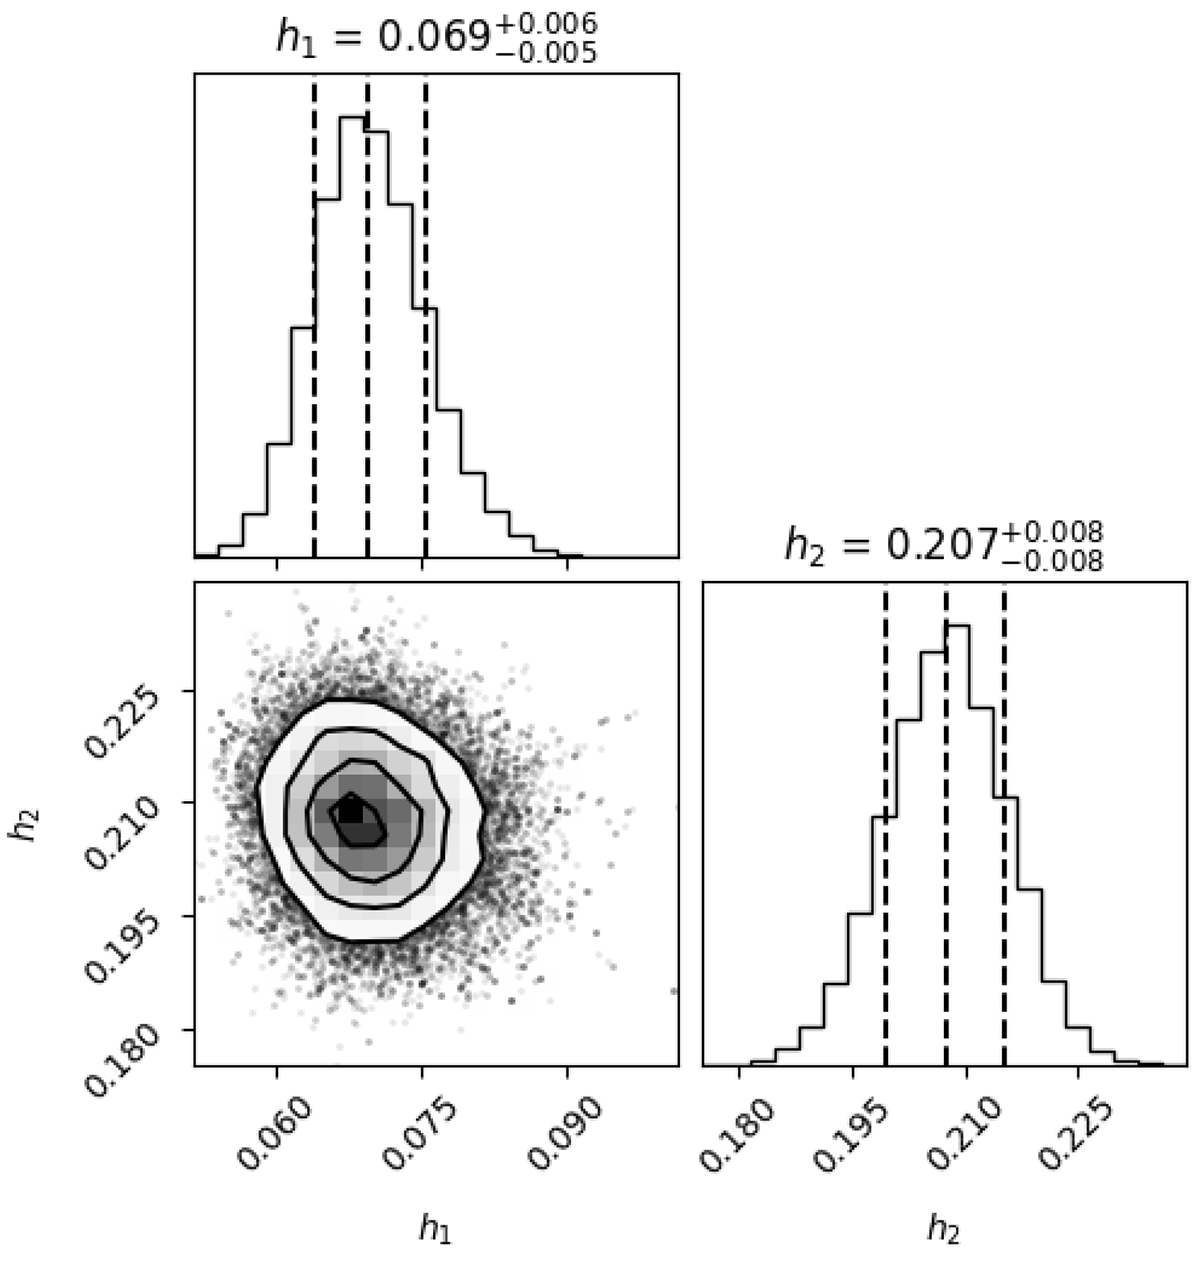
Corner plot showing the posterior probability distributions of the bandwidths (h1, h2) of the KDE LF, which were obtained with the routine provided by Yuan et al. (2022). Uncertainties correspond to the 16th and 84th percentiles, while the best-fit value is the median.
Current usage metrics show cumulative count of Article Views (full-text article views including HTML views, PDF and ePub downloads, according to the available data) and Abstracts Views on Vision4Press platform.
Data correspond to usage on the plateform after 2015. The current usage metrics is available 48-96 hours after online publication and is updated daily on week days.
Initial download of the metrics may take a while.