Open Access
Fig. 8
Download original image
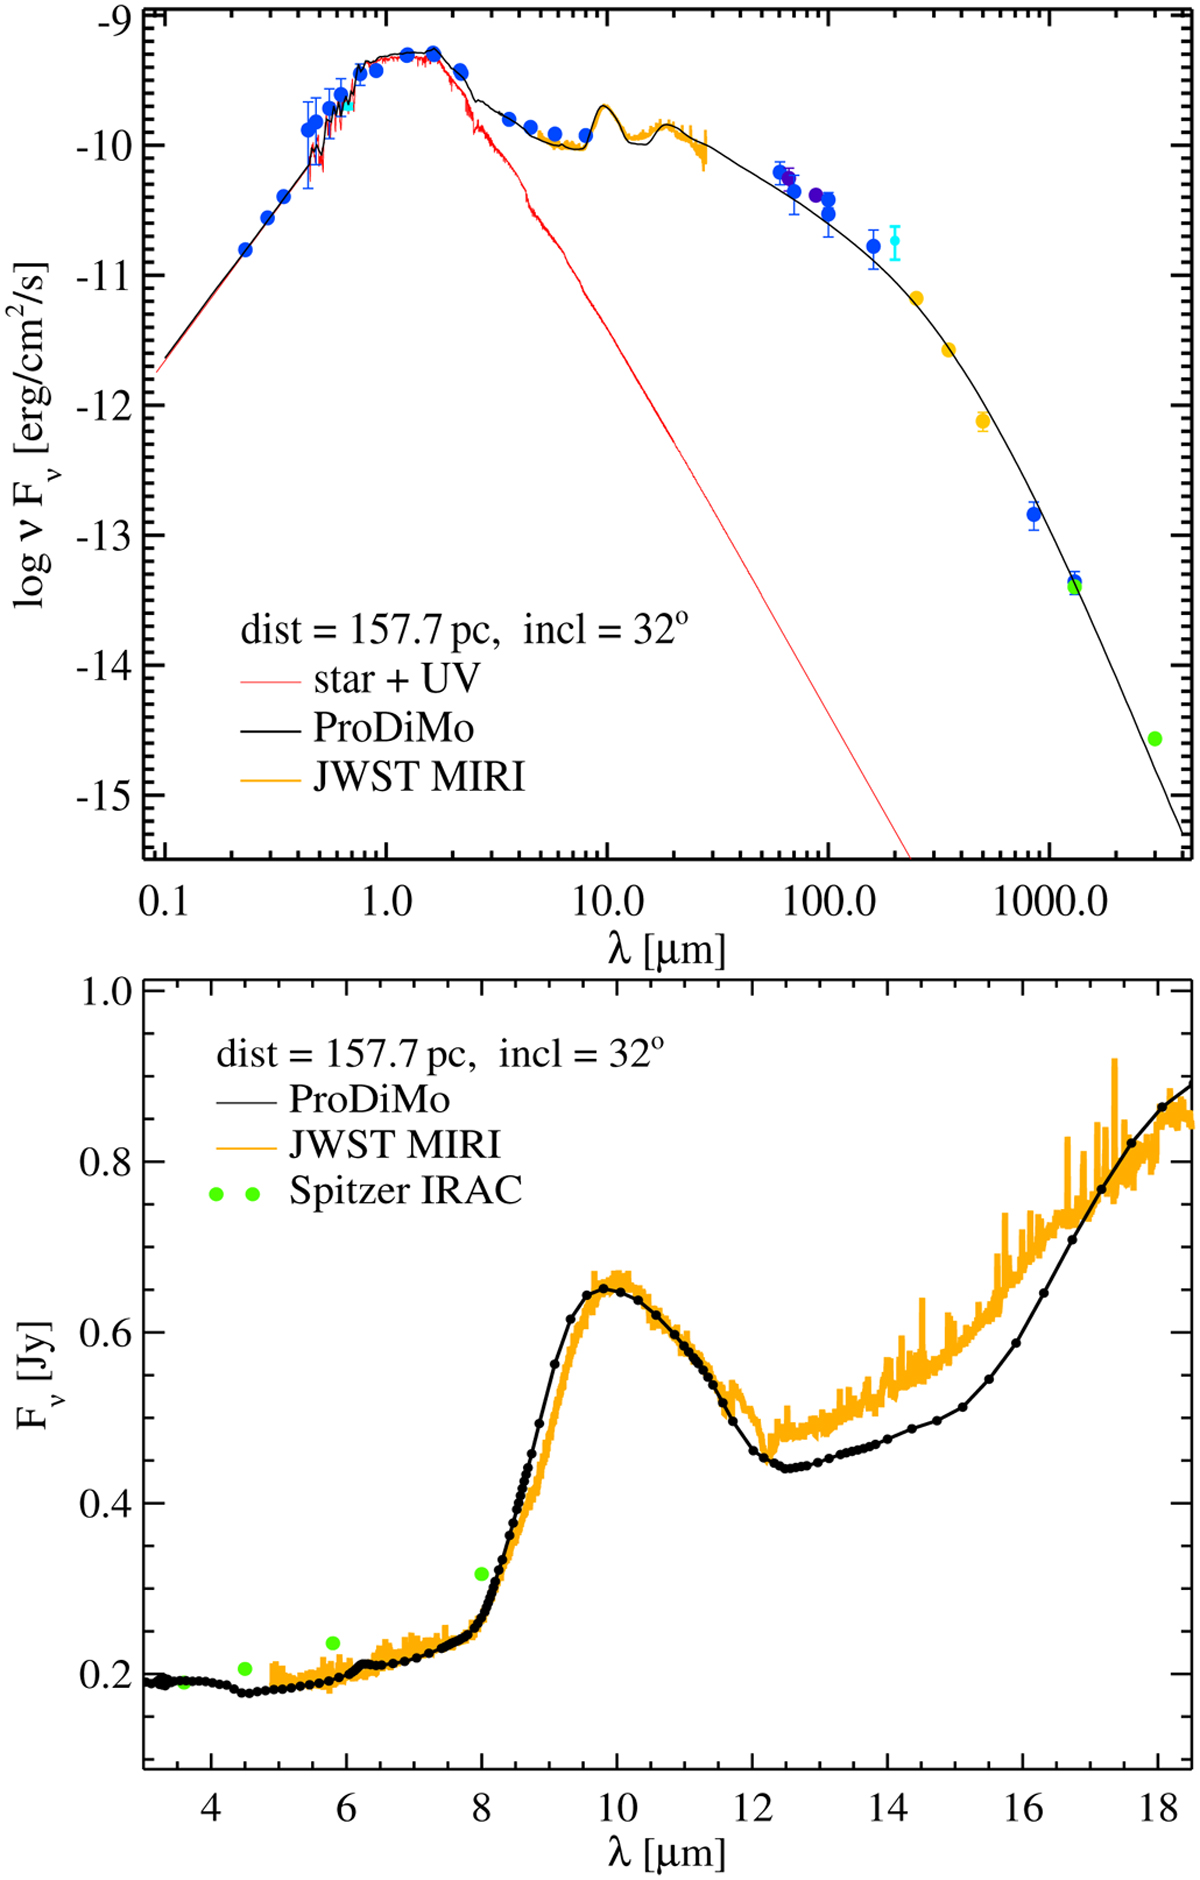
Fit of the SED of EX Lupi in the quiescent state. The orange and green data points in the upper plot are Herschel/SPIRE and ALMA measurements. The orange spectrum is the JWST/MIRI data. The lower plot shows a magnification of the MIR spectral region.
Current usage metrics show cumulative count of Article Views (full-text article views including HTML views, PDF and ePub downloads, according to the available data) and Abstracts Views on Vision4Press platform.
Data correspond to usage on the plateform after 2015. The current usage metrics is available 48-96 hours after online publication and is updated daily on week days.
Initial download of the metrics may take a while.