Fig. 8.
Download original image
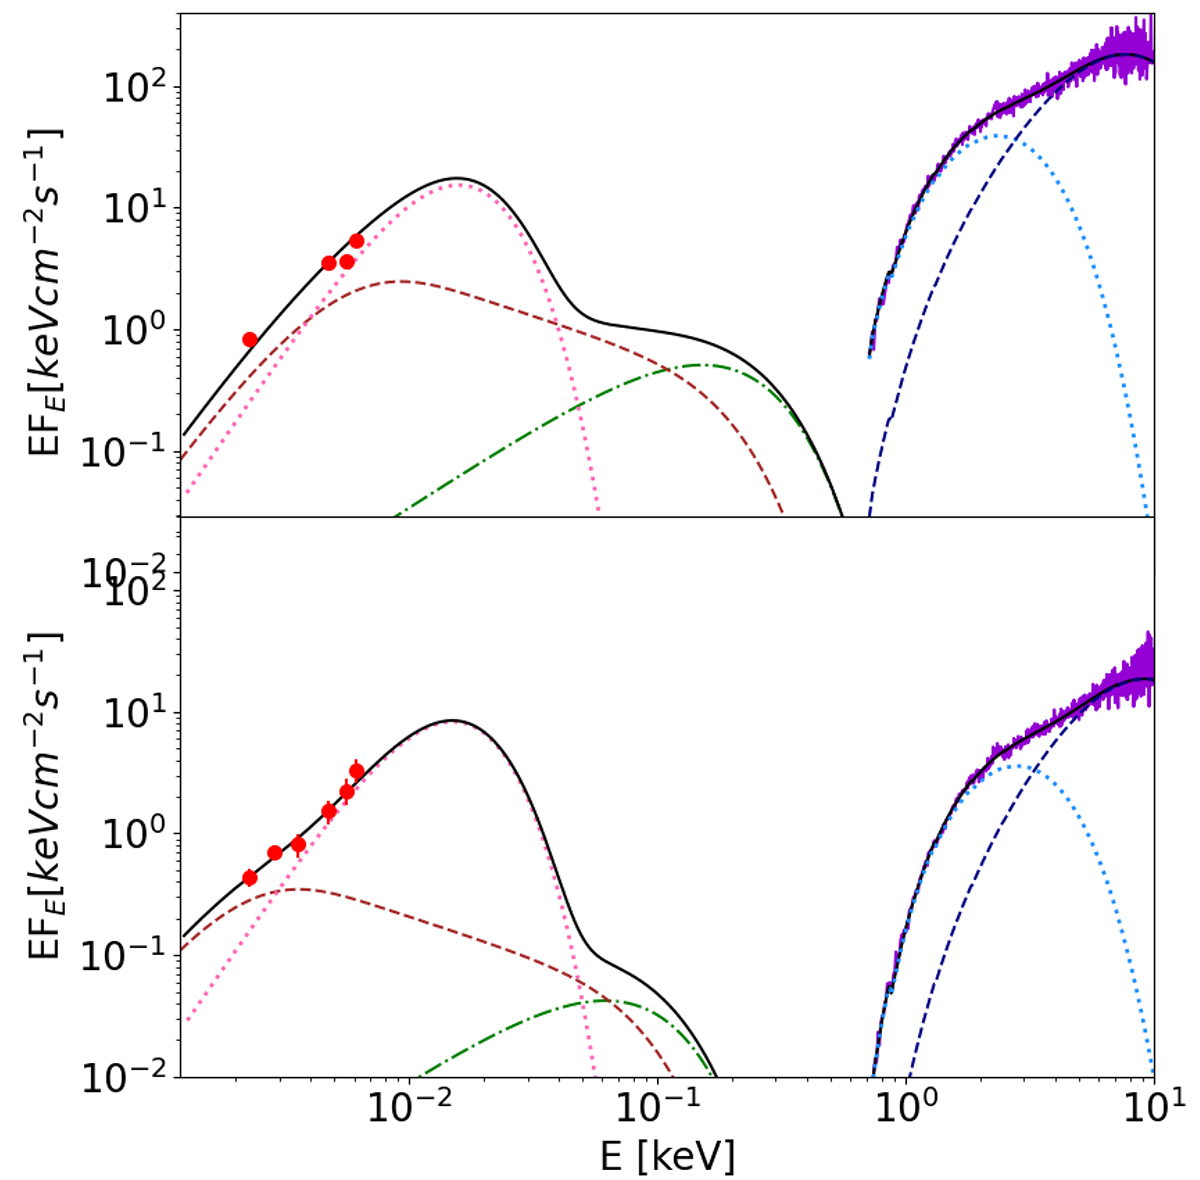
Models considered in this work to fit the optical/UV observations (red points) and XRT spectra (purple line) for days 58062 MJD (up) and 58094 MJD (bottom). The contribution of X-ray heating of the companion star is represented with a pink dotted line, the irradiated disk is plotted as a brown dashed line, the viscously heated disk is plotted with a green dash-dotted line. The xspec models bbodyrad and pegpowerlaw used to fit the XRT spectra are plotted with light blue dotted and navy blue dashed lines, respectively.
Current usage metrics show cumulative count of Article Views (full-text article views including HTML views, PDF and ePub downloads, according to the available data) and Abstracts Views on Vision4Press platform.
Data correspond to usage on the plateform after 2015. The current usage metrics is available 48-96 hours after online publication and is updated daily on week days.
Initial download of the metrics may take a while.