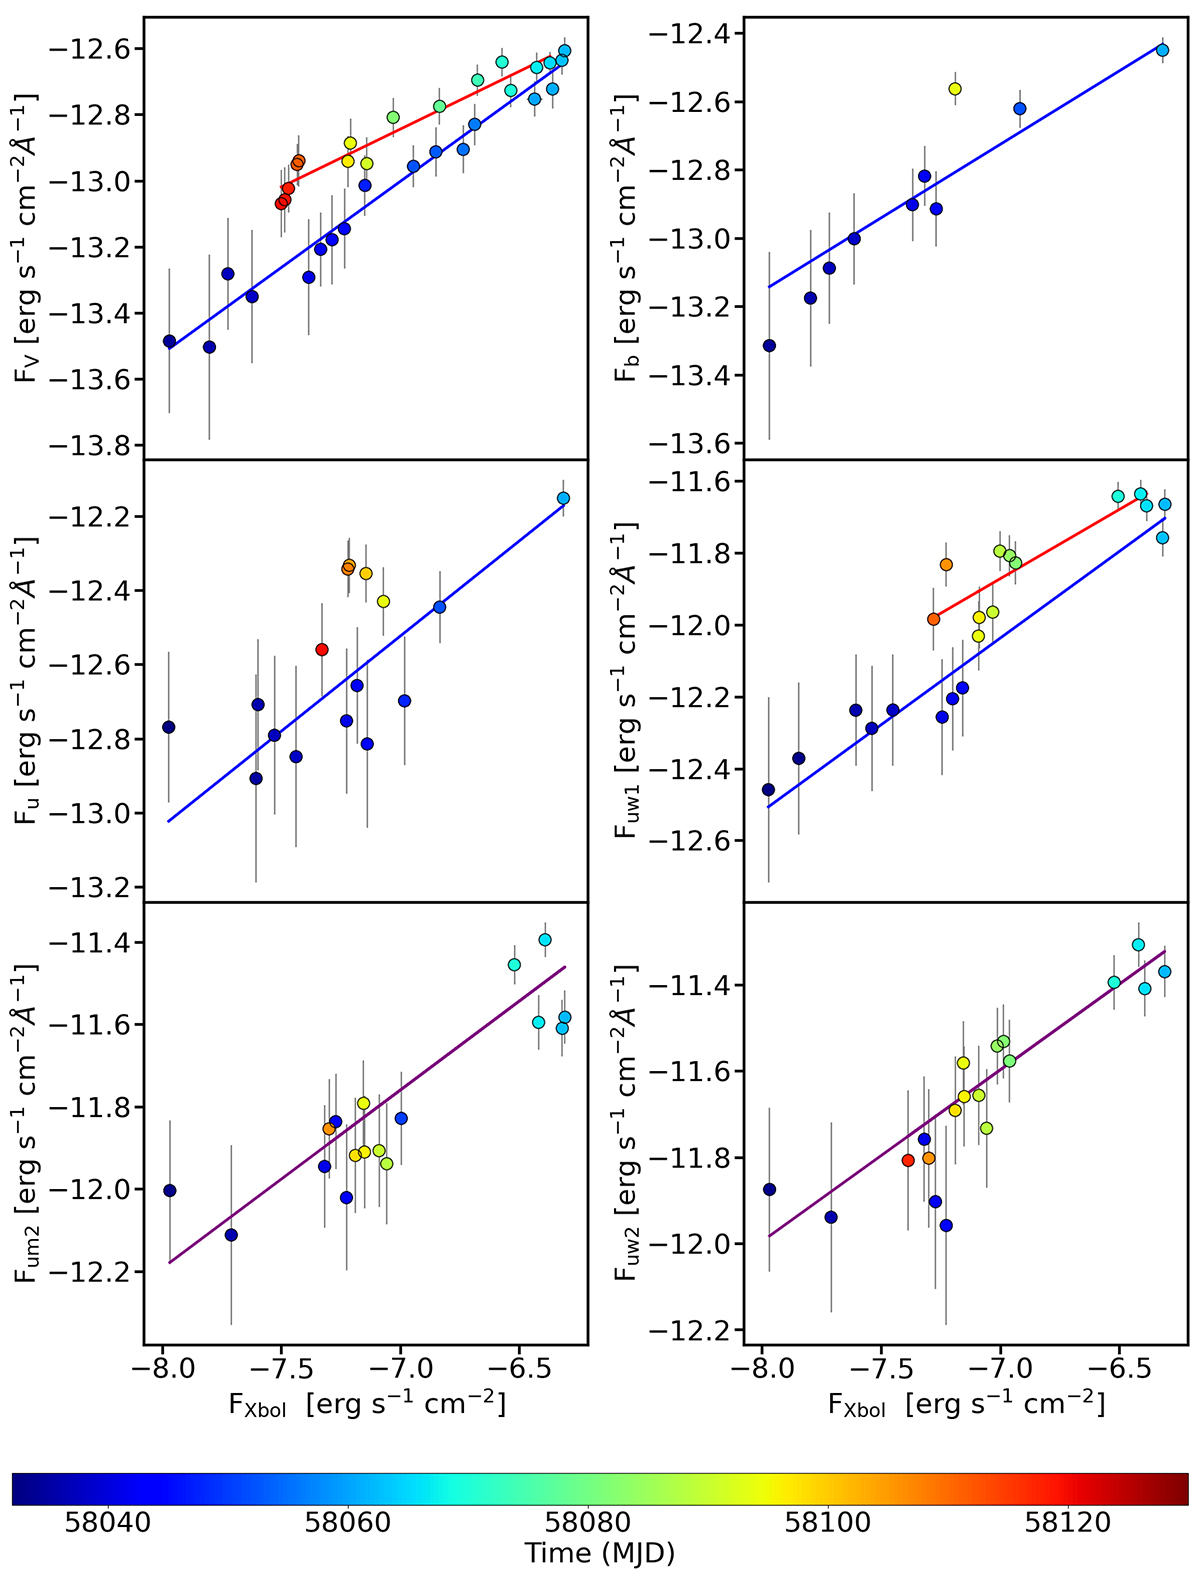
Fig. 7.
Download original image
Optical/UV versus X-ray (0.1−500 keV) logarithmic fluxes along the outburst of Swift J0243.6+6124. The correlations show different slopes during the outburst rise than during the decay epochs for the filters with longer wavelengths (V-Johnson to UVOT-uw1). In this case, different fits have been performed for the rise (blue line) than for the decay (red line). For the UVOT-um2 and UVOT-uw2 filters, a global fit (purple line) has been performed.
Current usage metrics show cumulative count of Article Views (full-text article views including HTML views, PDF and ePub downloads, according to the available data) and Abstracts Views on Vision4Press platform.
Data correspond to usage on the plateform after 2015. The current usage metrics is available 48-96 hours after online publication and is updated daily on week days.
Initial download of the metrics may take a while.