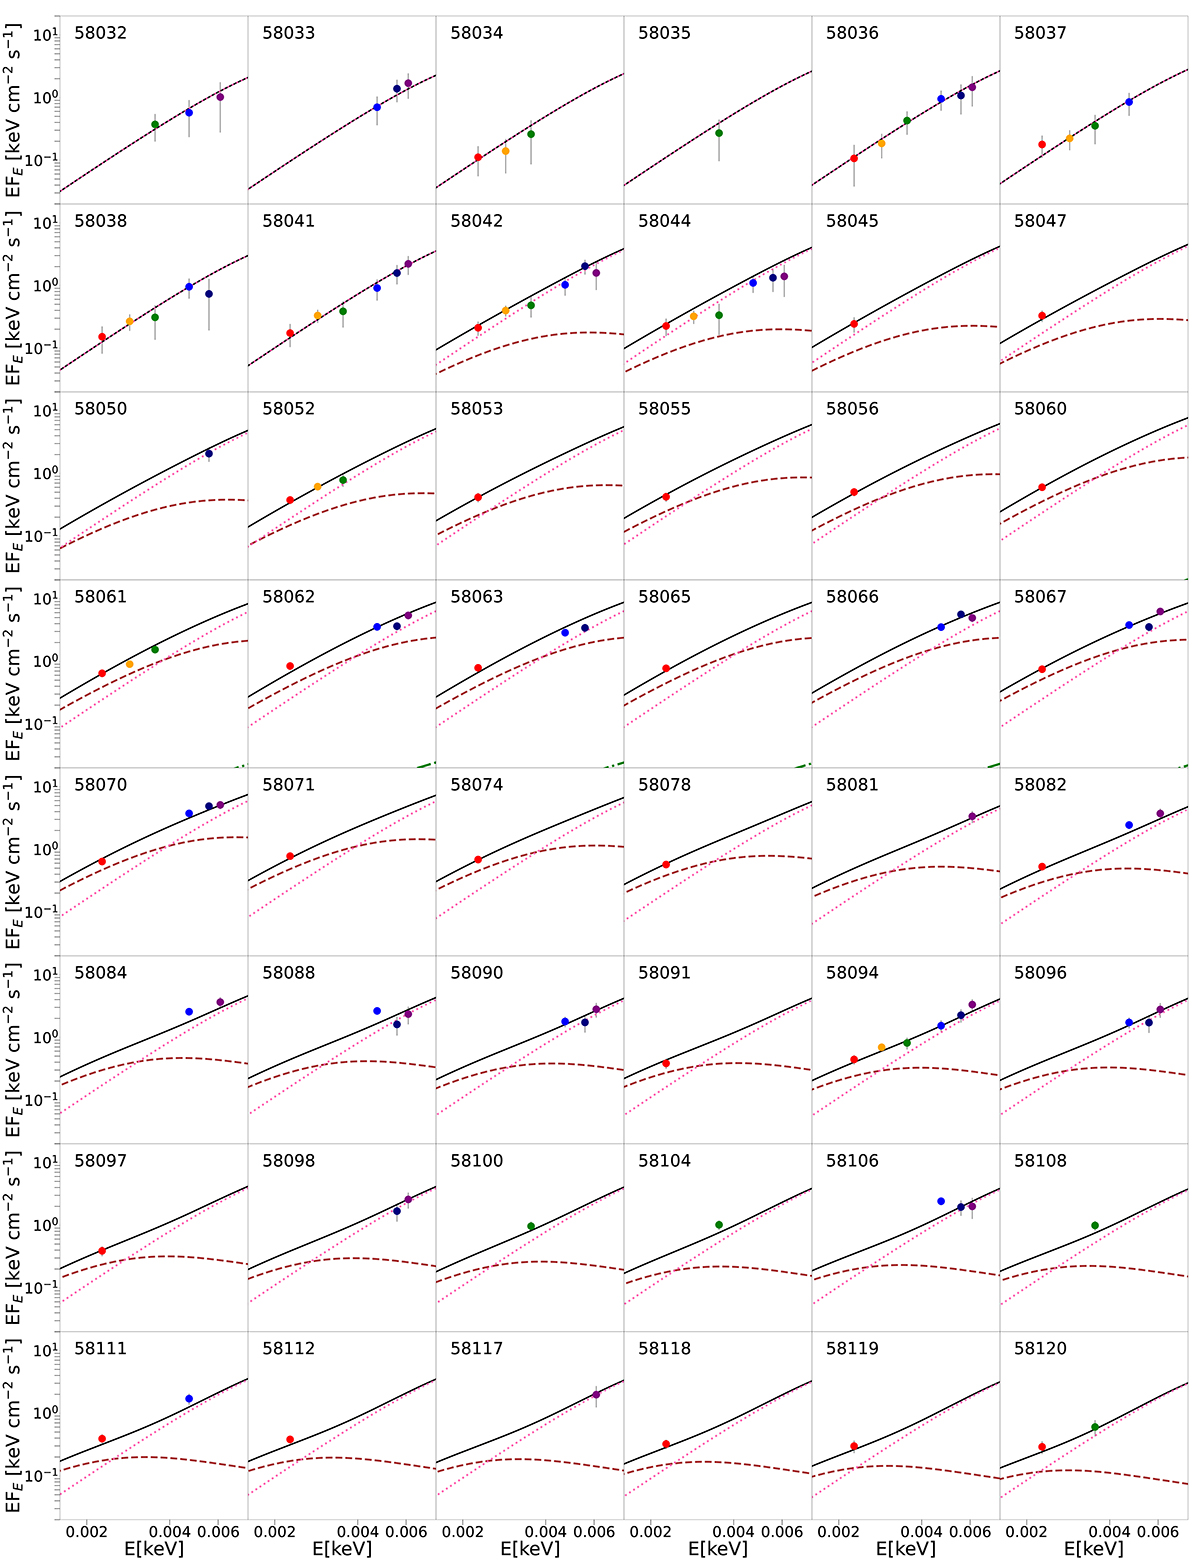
Fig. 10.
Download original image
Optical/UV SEDs evolution along the outburst. The reddening corrected observed fluxes are plotted with different colours: V-Johnson in red, UVOT-b in yellow, UVOT-u in green, UVOT-uw1 in blue, UVOT-um2 in navy blue, and UVOT-uw2 in purple. Error bars are plotted in gray. Best fitted model predictions are plotted for comparison (black solid lines). The pink dotted lines represent the modelled contribution by the extra emission from heating the surface of the companion star. The brown dashed lines correspond to the contribution from an irradiated accretion disk with the value of Rout providing the best fit.
Current usage metrics show cumulative count of Article Views (full-text article views including HTML views, PDF and ePub downloads, according to the available data) and Abstracts Views on Vision4Press platform.
Data correspond to usage on the plateform after 2015. The current usage metrics is available 48-96 hours after online publication and is updated daily on week days.
Initial download of the metrics may take a while.