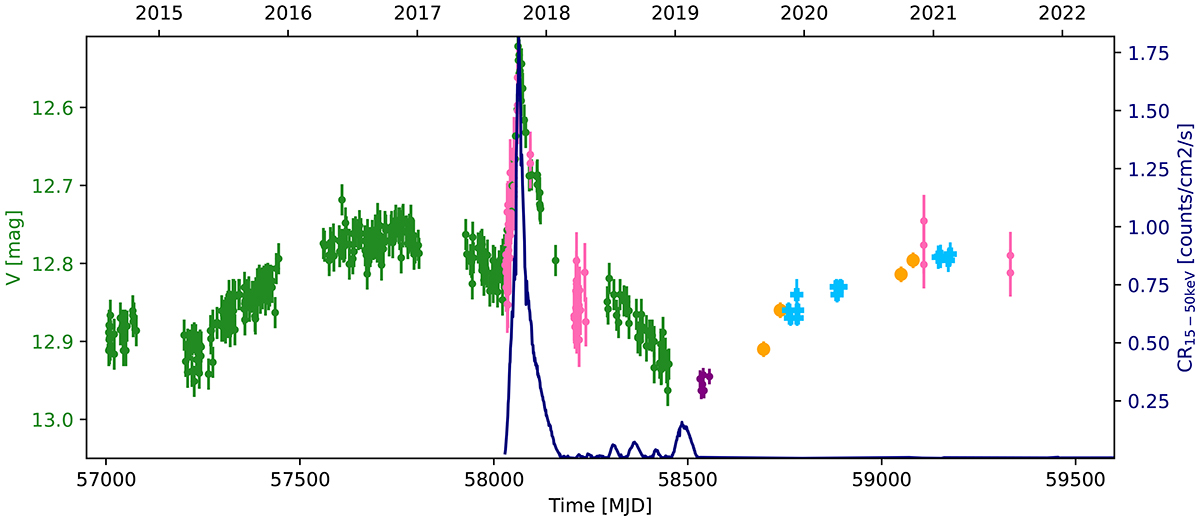
Fig. 1.
Download original image
Optical versus X-ray long-term light curves of Swift J0243.6+6124. The optical light curve contains observations from different sites: green points come from ASAS–SN Variable Stars Database, pink points correspond to converted Swift/UVOT–v observations, purple points are from AAVSO, orange points are from Skinakas observatory, and light blue points are from Aras de los Olmos Observatory (see Sect. 2.1 for details). The navy blue line represents the X-ray count rate light curve measured with Swift/BAT in the 15−50 keV band.
Current usage metrics show cumulative count of Article Views (full-text article views including HTML views, PDF and ePub downloads, according to the available data) and Abstracts Views on Vision4Press platform.
Data correspond to usage on the plateform after 2015. The current usage metrics is available 48-96 hours after online publication and is updated daily on week days.
Initial download of the metrics may take a while.