Fig. 5
Download original image
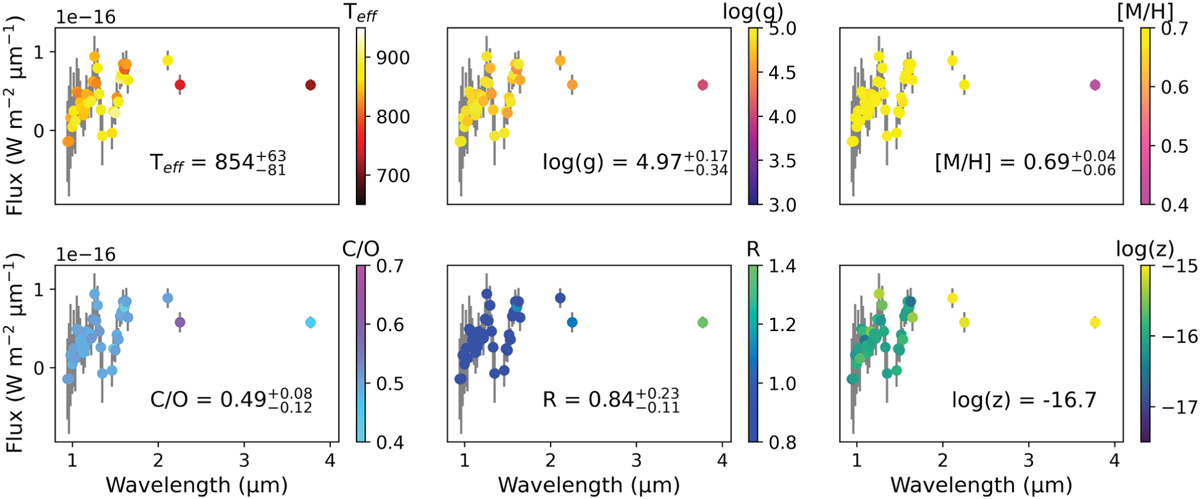
Leave-one-out analysis for the model with default priors. This figure consists of six panels where the M-F dataset is plotted and the behavior of the posteriors analyzed for each parameter. A color level is assigned to each point of the spectrum representing the derived values when that point was excluded from the fit. In each panel the posterior value for the case where all points were included is given to guide the comparison.
Current usage metrics show cumulative count of Article Views (full-text article views including HTML views, PDF and ePub downloads, according to the available data) and Abstracts Views on Vision4Press platform.
Data correspond to usage on the plateform after 2015. The current usage metrics is available 48-96 hours after online publication and is updated daily on week days.
Initial download of the metrics may take a while.