Fig. 3
Download original image
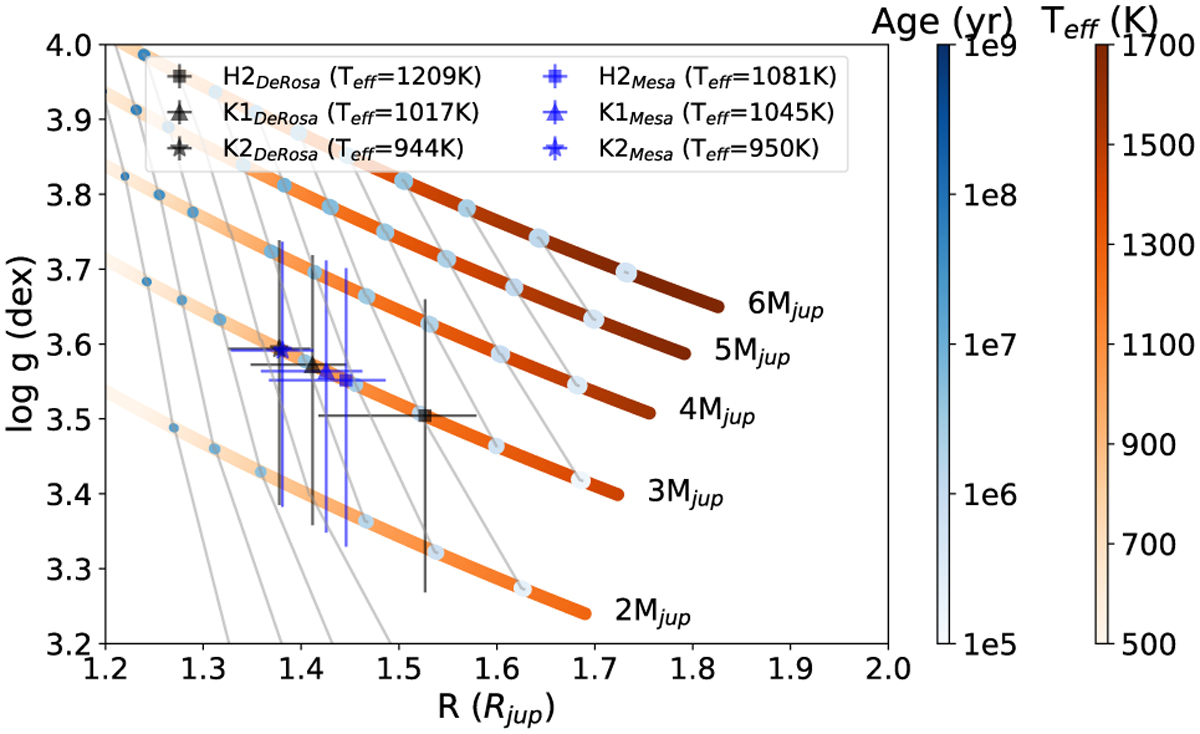
Evolutionary models from BEX-Hot-COND03. The model curves are a function of R and log(g), which are represented in terms of their age and Teff variations by two different color scales. The red-yellow lines represent iso-mass curves; the gray lines show iso-temperature curves; and the blue-white scale gives the age variations. For AF Lep b the predicted values of Teff range from 950 to 1200 K and of R between 1.2 and 1.4 RJup; log(g) ~ 3.8 dex using the absolute magnitudes from the photometry points published by De Rosa et al. (2023; black) and Mesa et al. (2023; blue). The errors from the magnitude values were propagated onto log(g) and R.
Current usage metrics show cumulative count of Article Views (full-text article views including HTML views, PDF and ePub downloads, according to the available data) and Abstracts Views on Vision4Press platform.
Data correspond to usage on the plateform after 2015. The current usage metrics is available 48-96 hours after online publication and is updated daily on week days.
Initial download of the metrics may take a while.