Fig. 2
Download original image
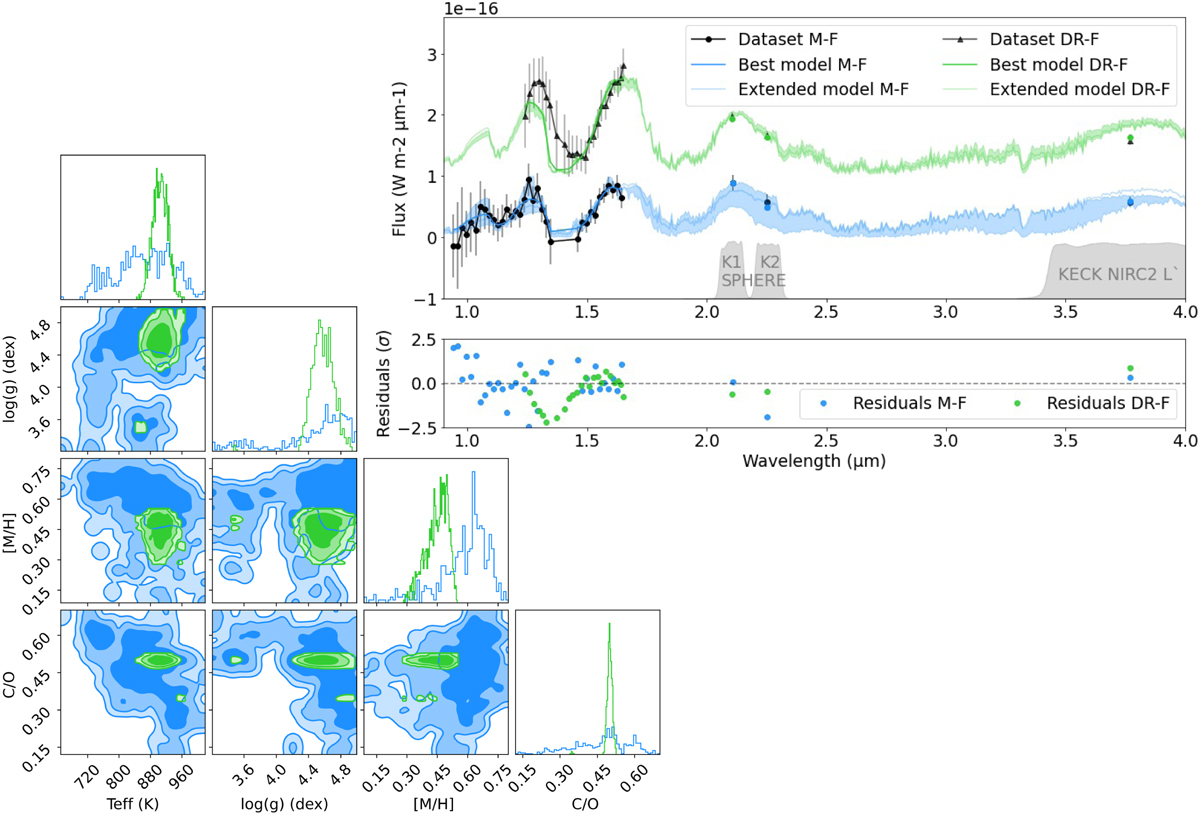
Best fit for the two datasets using Exo-REM with only grid parameters. The left panel shows the posterior distributions. The upper right panel shows the models, with an offset applied to the DR-F dataset. We extrapolated the models to visualize the complete spectral energy distribution from 0.9 to 4 µm at Rλ = 100. The colored areas represent rough variations on the models when considering 1 σ uncertainties for each parameter.
Current usage metrics show cumulative count of Article Views (full-text article views including HTML views, PDF and ePub downloads, according to the available data) and Abstracts Views on Vision4Press platform.
Data correspond to usage on the plateform after 2015. The current usage metrics is available 48-96 hours after online publication and is updated daily on week days.
Initial download of the metrics may take a while.