Fig. 6
Download original image
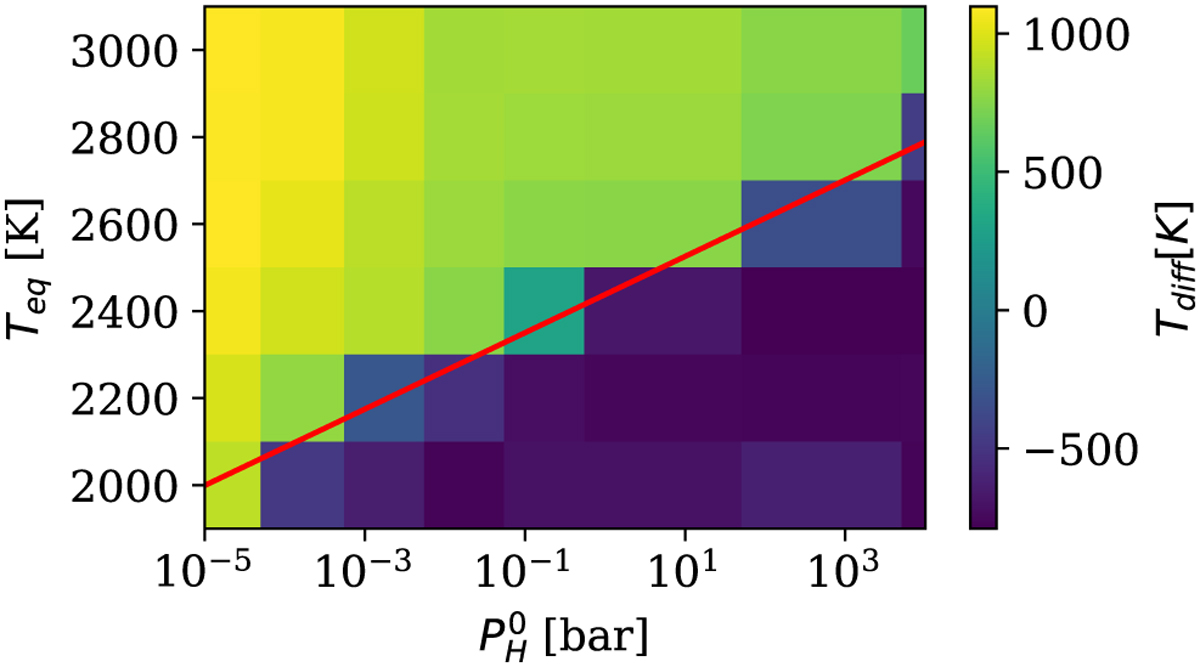
Difference in temperatures, Tdiff, shown in color, as defined in Eq. (5), at a pressure where τm = 10−3 (around 10−6 bar) and the surface, for different hydrogen content ![]() and equilibrium temperature, Teq. Positive values indicate inverted PT profiles (presence of thermal inversion). Negative values indicate non-inverted PT profiles (absence of thermal inversion). The shift between the two regimes does not occur at the same hydrogen content for different equilibrium temperatures (hotter planets require more hydrogen to fall into the non-inverted category). This is indicated by the (fitted) red line, for which the formula is given in Eq. (6).
and equilibrium temperature, Teq. Positive values indicate inverted PT profiles (presence of thermal inversion). Negative values indicate non-inverted PT profiles (absence of thermal inversion). The shift between the two regimes does not occur at the same hydrogen content for different equilibrium temperatures (hotter planets require more hydrogen to fall into the non-inverted category). This is indicated by the (fitted) red line, for which the formula is given in Eq. (6).
Current usage metrics show cumulative count of Article Views (full-text article views including HTML views, PDF and ePub downloads, according to the available data) and Abstracts Views on Vision4Press platform.
Data correspond to usage on the plateform after 2015. The current usage metrics is available 48-96 hours after online publication and is updated daily on week days.
Initial download of the metrics may take a while.