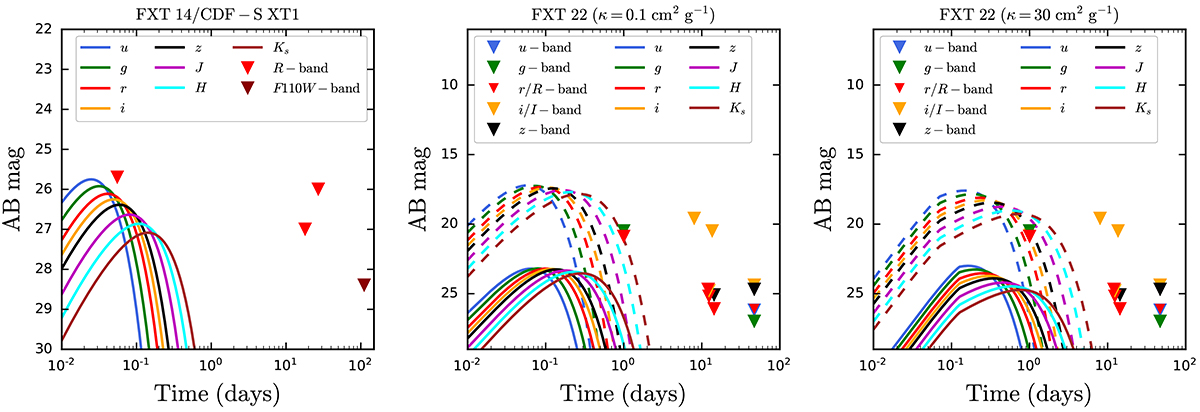
Fig. 9.
Download original image
Numerical solution of the merger-nova emission in different energy bands. Left panel: optical and NIR upper limits of FXT 14 and the expected merger-nova emission (from u- to K-bands) assuming their best fitting parameters (see Table 2) and z = 2.23 (solid lines). As a middle and right panels: optical and NIR upper limits of FXT 22, and the merger-nova emission considering the derived magnetar parameters (see Table 2), two redshifts of z = 1.0 (solid lines) and 0.1 (dashed lines), and assuming lanthanide-free (middle panel; κ = 0.1 cm2 g−1 and Mej = 10−4 M⊙) and rich (right panel; κ = 30 cm2 g−1 and Mej = 10−3 M⊙) scenarios. The upper limits of FXT 14 were taken from Bauer et al. (2017), while for FXT 22 from Andreoni et al. (2021a,b,c), Xin et al. (2021), Rossi et al. (2021), and Eappachen et al. (2023). The time is measured from the X-ray trigger detection of the FXTs.
Current usage metrics show cumulative count of Article Views (full-text article views including HTML views, PDF and ePub downloads, according to the available data) and Abstracts Views on Vision4Press platform.
Data correspond to usage on the plateform after 2015. The current usage metrics is available 48-96 hours after online publication and is updated daily on week days.
Initial download of the metrics may take a while.