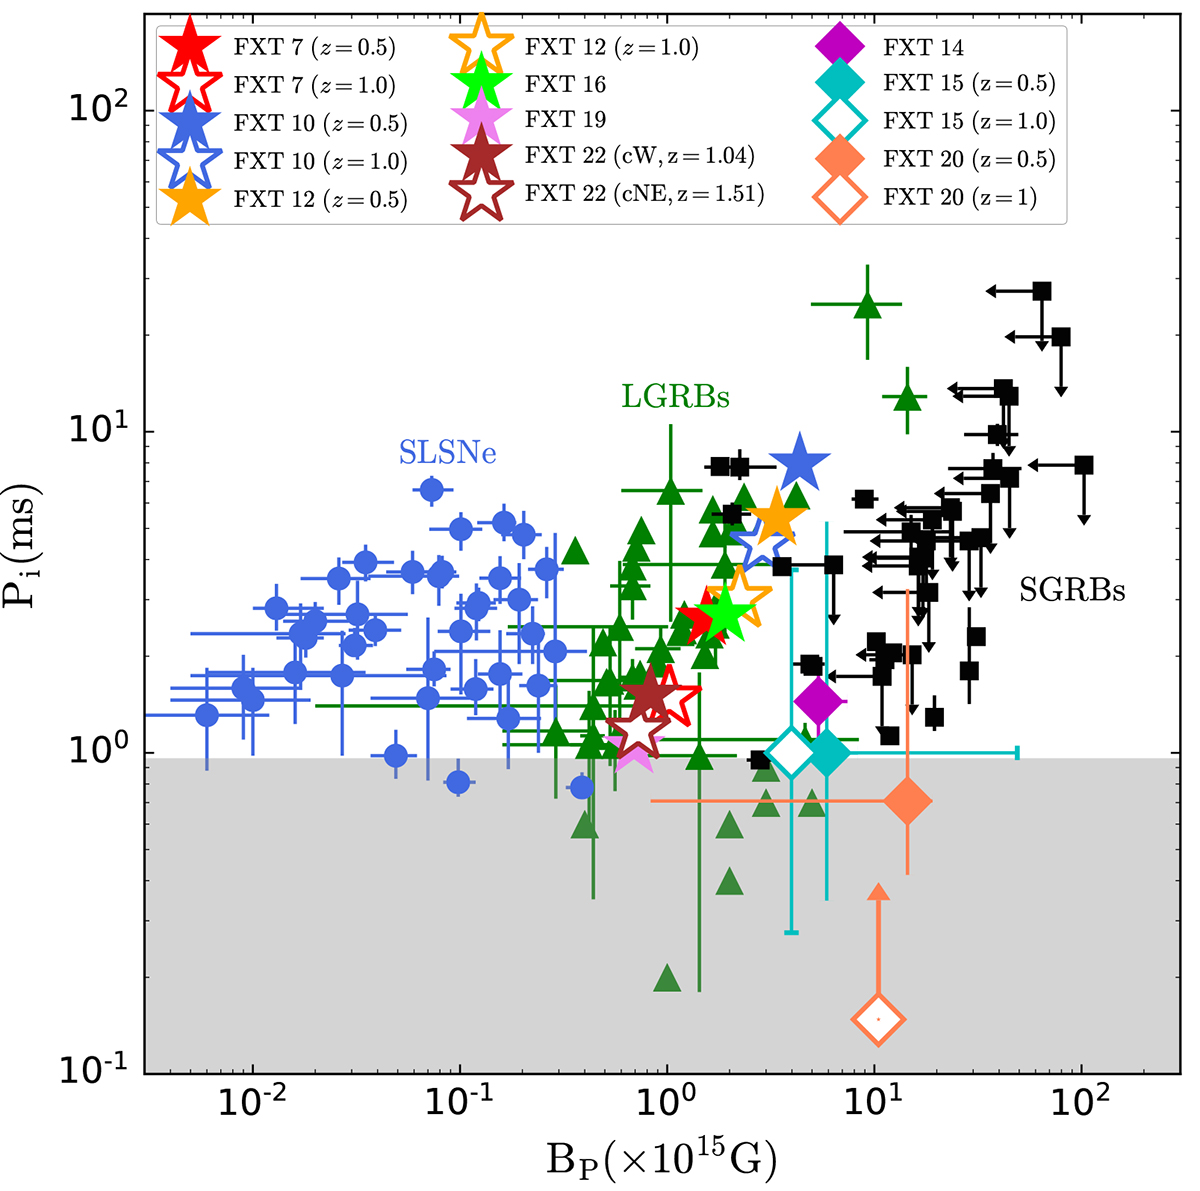
Fig. 8.
Download original image
Comparison of the derived magnetar parameters in this work (BP and Pi) with LGRBs (green triangles; Lyons et al. 2010; Yi et al. 2014), SGRBs (black squares; Rowlinson et al. 2010, 2013; Lü et al. 2015) and SLSNe (blue circles; Nicholl et al. 2017). The gray region represents the breakup limit of a neutron star, which is around 0.96 ms (Lattimer & Prakash 2004). FXTs related to the free and trapped models are represented by star and diamond markers, respectively.
Current usage metrics show cumulative count of Article Views (full-text article views including HTML views, PDF and ePub downloads, according to the available data) and Abstracts Views on Vision4Press platform.
Data correspond to usage on the plateform after 2015. The current usage metrics is available 48-96 hours after online publication and is updated daily on week days.
Initial download of the metrics may take a while.