Fig. 3.
Download original image
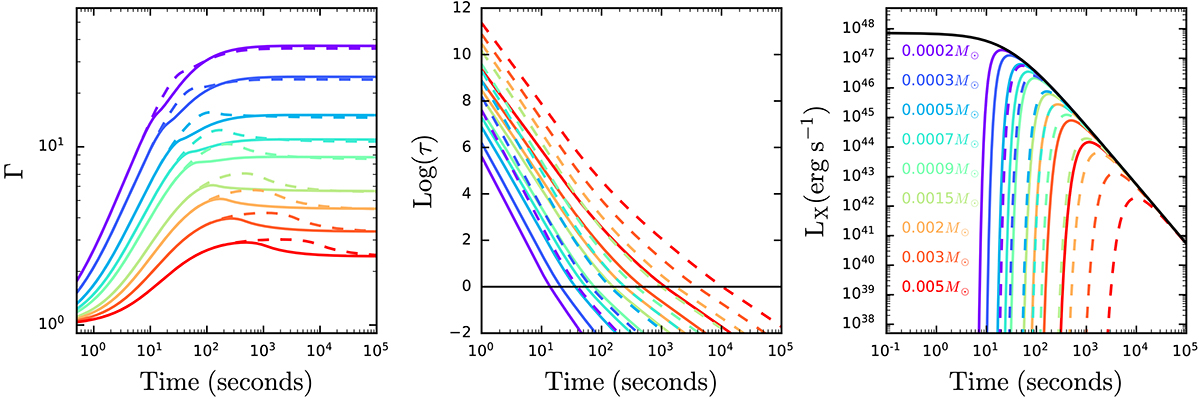
Theoretical results of the trapped-zone emission. Left panel: evolution of Lorentz factor (Γ). Middle panel: logarithmic optical depth (τ). The black horizontal line represents the optical depth limit at τ = 1. Right panel: X-ray luminosity (LX) of the magnetar model (Eq. (8), first term). The solid black line shows the free zone spin-down luminosity (ηLsd). The color code shows the different ejecta masses (Mej = 2 × 10⁻⁴ − 5 × 10⁻³ M⊙), while the solid and dashed lines represent opacities of 1.0 and 10.0 cm2 g−1, respectively, expected for the blue and red kilonova (Tanaka et al. 2017; Metzger 2019; Tanaka et al. 2020). The initial conditional assumed are: the initial velocity and internal ejecta energy of the ejecta are βi = 0.1, and ![]() , respectively. The magnetar parameters are: Bp = 5 × 10¹⁵ G, Pi = 10−3 s, I = 1045 g cm2, ϵ = 10−5, and ξ = 0.3.
, respectively. The magnetar parameters are: Bp = 5 × 10¹⁵ G, Pi = 10−3 s, I = 1045 g cm2, ϵ = 10−5, and ξ = 0.3.
Current usage metrics show cumulative count of Article Views (full-text article views including HTML views, PDF and ePub downloads, according to the available data) and Abstracts Views on Vision4Press platform.
Data correspond to usage on the plateform after 2015. The current usage metrics is available 48-96 hours after online publication and is updated daily on week days.
Initial download of the metrics may take a while.