Open Access
Fig. C.6.
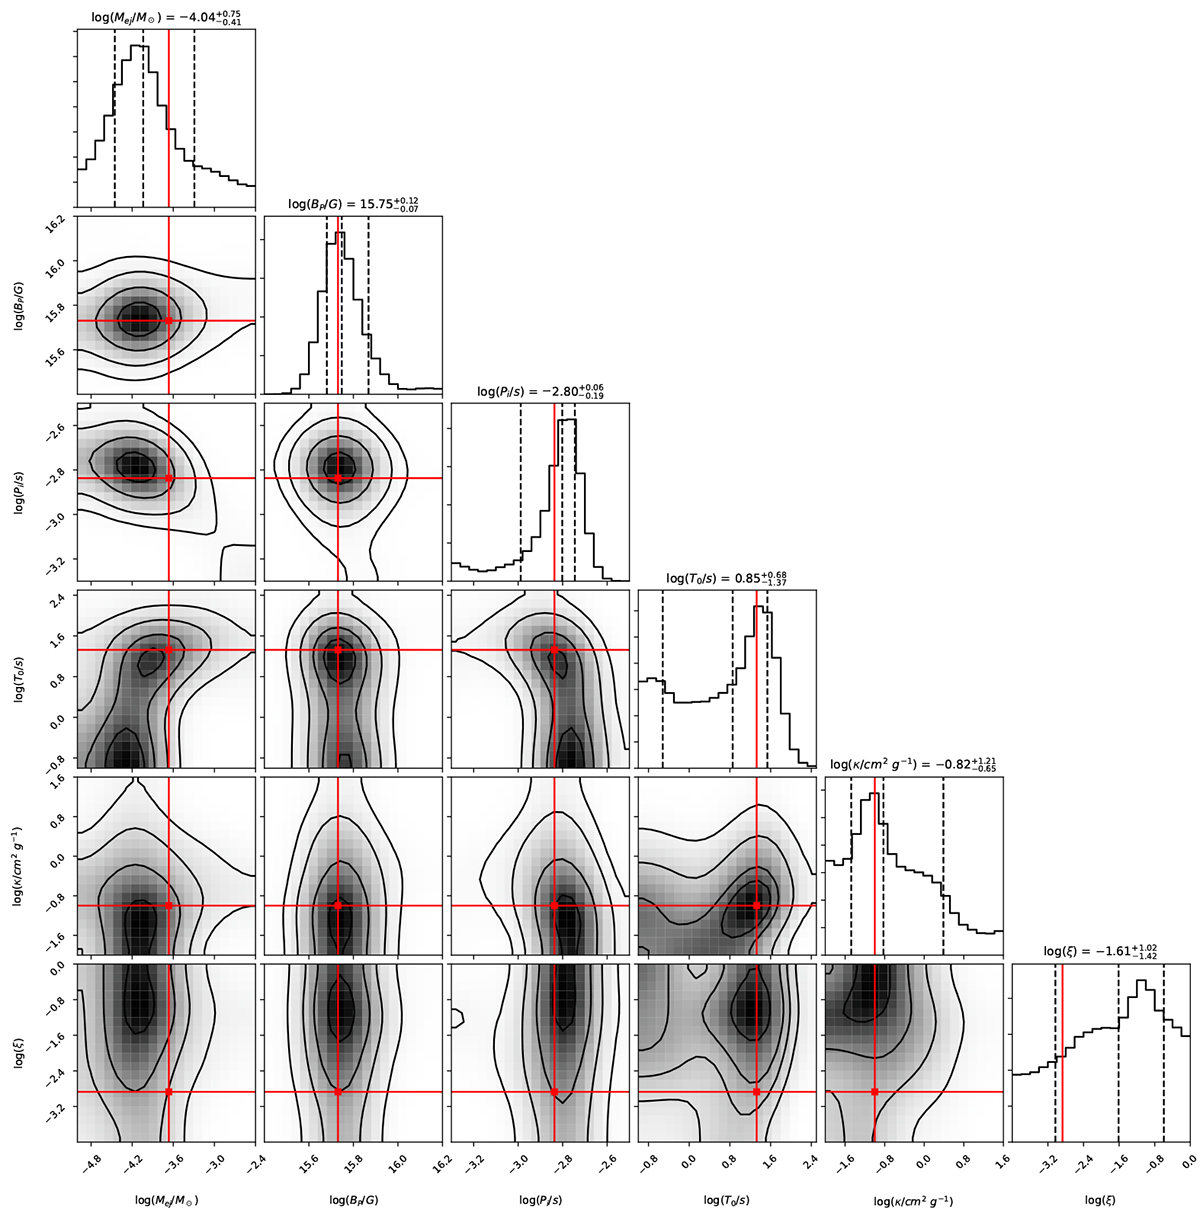
Download original image
MCMC posterior distribution for the trapped zone fitting result of FXT 14. The dashed black lines show the 16%, 50% and 84% percentile of the MCMC results, while the red lines depict the parameters of the best-fitted model.
Current usage metrics show cumulative count of Article Views (full-text article views including HTML views, PDF and ePub downloads, according to the available data) and Abstracts Views on Vision4Press platform.
Data correspond to usage on the plateform after 2015. The current usage metrics is available 48-96 hours after online publication and is updated daily on week days.
Initial download of the metrics may take a while.