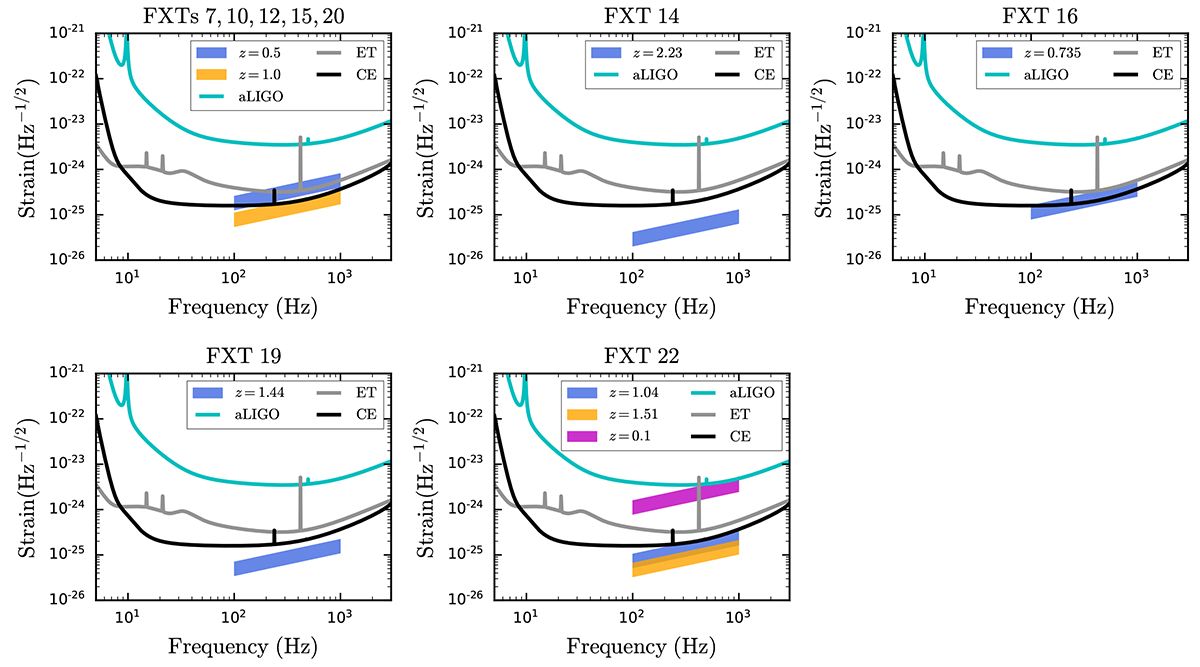
Fig. 10.
Download original image
GW strain evolution with frequency for the FXTs analyzed in this work. Each shaded region represents the GW strain considering eight EoS (see Table 3) at different distances. The cyan, gray, and black lines are the sensitivity limits for aLIGO, ET, and CE GW telescopes, respectively. For the FXTs without redshifts (FXTs 7, 10, 12, 15, and 20), we assumed z = 0.5 and 1.0 (see Table 2).
Current usage metrics show cumulative count of Article Views (full-text article views including HTML views, PDF and ePub downloads, according to the available data) and Abstracts Views on Vision4Press platform.
Data correspond to usage on the plateform after 2015. The current usage metrics is available 48-96 hours after online publication and is updated daily on week days.
Initial download of the metrics may take a while.