Open Access
Fig. 1.
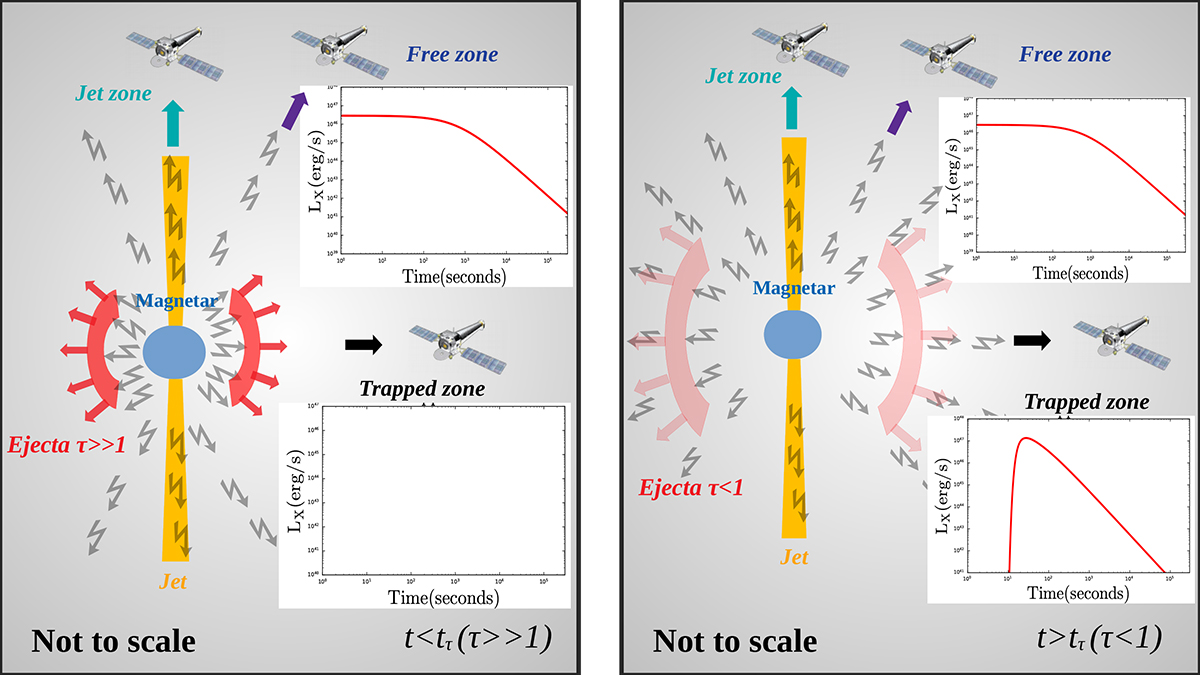
Download original image
Cartoon illustrating the jet, free, and trapped zones, according to the magnetar model for FXTs. Left panel: situation at time t < tτ. Right panel: situation at time t > tτ. The insets in both panels show the light curves expected for the free and trapped zones before and after tτ.
Current usage metrics show cumulative count of Article Views (full-text article views including HTML views, PDF and ePub downloads, according to the available data) and Abstracts Views on Vision4Press platform.
Data correspond to usage on the plateform after 2015. The current usage metrics is available 48-96 hours after online publication and is updated daily on week days.
Initial download of the metrics may take a while.