Fig. 2.
Download original image
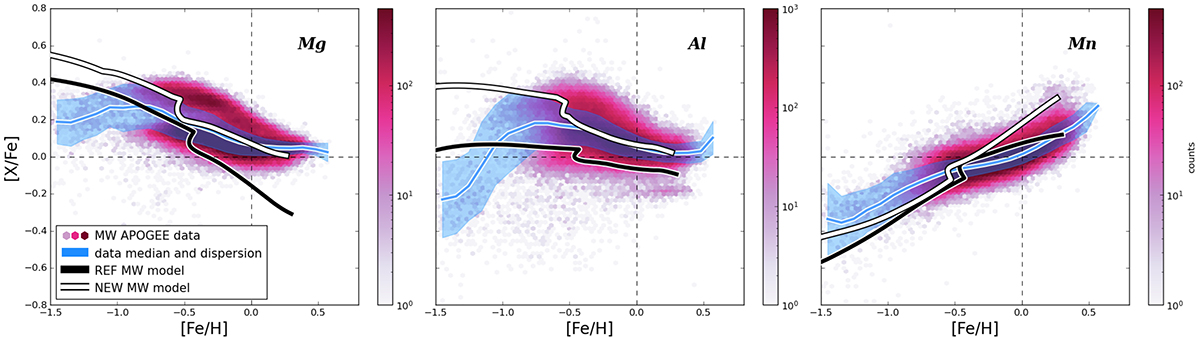
Abundance ratios of the three elements involved. The data are from APOGEE DR17 and are binned and colour-coded according to the data density in each bin. The blue line represents the running median, computed assuming a bin size of 0.1 dex and an overlap of 0.025 dex, and the blue shaded area represents the related standard deviation. Left panel: [Mg/Fe] in the MW as predicted by REF MW model (black line) and by NEW MW model (white line) compared to APOGEE data. Middle panel: [Al/Fe] MW abundance for both models (same colour-coding as left panel). Right panel: [Mn/Fe] abundance for REF MW and NEW MW models (same colour-coding).
Current usage metrics show cumulative count of Article Views (full-text article views including HTML views, PDF and ePub downloads, according to the available data) and Abstracts Views on Vision4Press platform.
Data correspond to usage on the plateform after 2015. The current usage metrics is available 48-96 hours after online publication and is updated daily on week days.
Initial download of the metrics may take a while.