Fig. 2.

Download original image
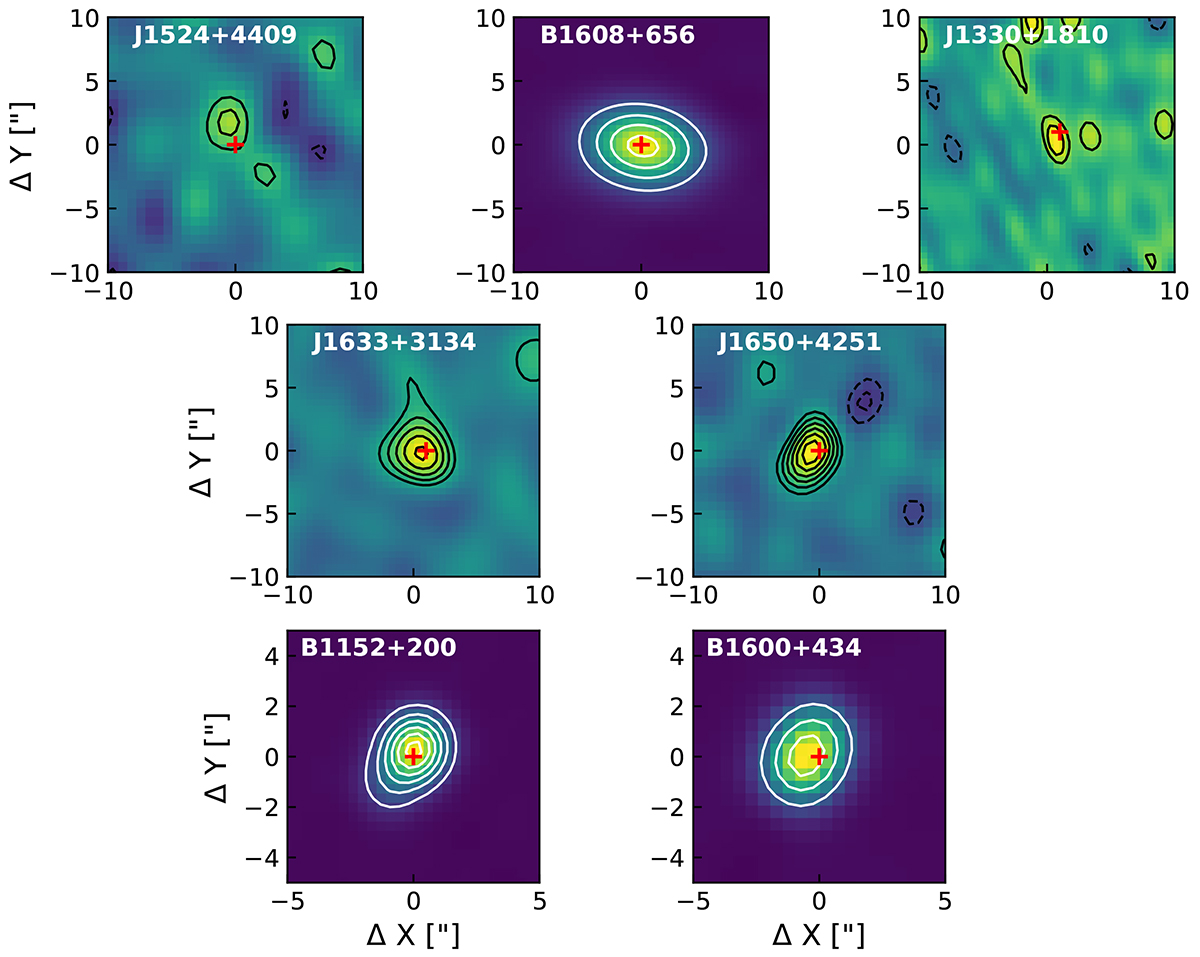
Detected continuum emission at the position of the CO(2–1) emission line for the sample presented in this work. Contours for J1524+4409, J1330+1810, J1633+3134, and J1650+4251 start at ±2σ and increase in intervals of ±1σ, where σ is given in Table 2. Contours are given in steps of ±50σ starting at 50σ for B1608 and in steps of ±100σ starting at 100σ for B1152 and B1600. The red cross indicates the peak position of the gas emission where detected, and the optical emission for the three QSOs not detected in CO(2–1).
Current usage metrics show cumulative count of Article Views (full-text article views including HTML views, PDF and ePub downloads, according to the available data) and Abstracts Views on Vision4Press platform.
Data correspond to usage on the plateform after 2015. The current usage metrics is available 48-96 hours after online publication and is updated daily on week days.
Initial download of the metrics may take a while.


