Fig. B.1.
Download original image
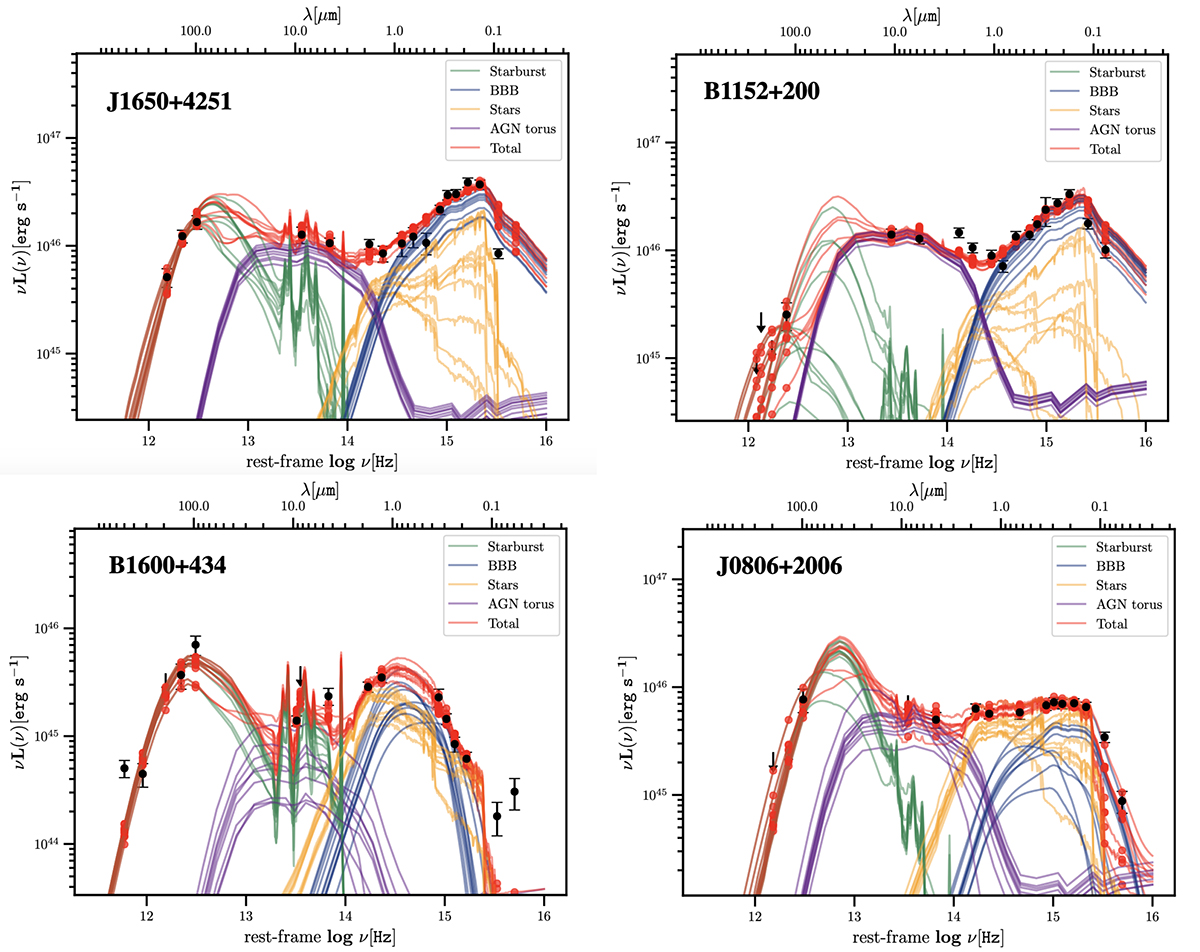
From top left to bottom right: SED fitting of J1524+4409, B1608+656, J1330+1810, J1455+1447, J1633+3134, and J0924+0214. The black dots represent the observed data points; 3σ upper limits are shown as downward arrows. The best-fit SED obtained with AGNfitter (Calistro Rivera et al. 2016), as well as the different components used to model the total flux are shown as labelled in the figure. Ten realisations picked from the posterior distribution are shown.
Current usage metrics show cumulative count of Article Views (full-text article views including HTML views, PDF and ePub downloads, according to the available data) and Abstracts Views on Vision4Press platform.
Data correspond to usage on the plateform after 2015. The current usage metrics is available 48-96 hours after online publication and is updated daily on week days.
Initial download of the metrics may take a while.