Fig. 9.
Download original image
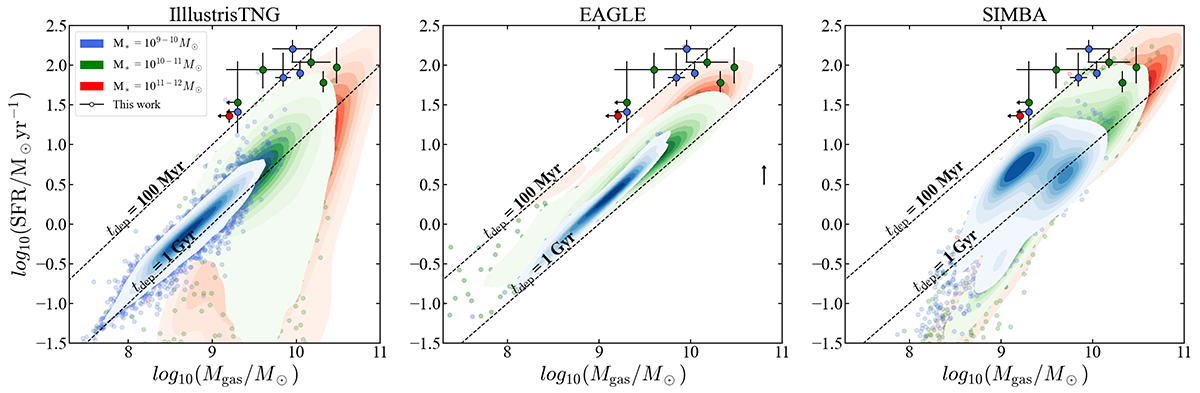
Distribution in the SFR–Mgas plane of the QSOs in this study, colour coded by their stellar mass. The contours show the position of galaxies with Lbol = 1042 − 46 erg s−1 and M* = 109 − 12 M⊙ from the IllustrisTNG (left), EAGLE (middle) and SIMBA (right) hydrodynamical simulations, separated in bins of stellar mass (109 − 10 M⊙, blue; 1010 − 11 M⊙, green; 1011 − 12 M⊙, red). The dashed lines indicate depletion times of 100 Myr and 1 Gyr. Since the SFRs in EAGLE are known to be 0.2 dex lower than observations of main–sequence galaxies (Furlong et al. 2015; McAlpine et al. 2017), we show by how much the SFRs would shift upwards if they matched the observations with the black arrow. The simulations struggle to reproduce the high SFRs of our sample given their low stellar mass, which is likely due to a lack of sufficient resolution in the subgrid physics models. Despite using gravitational lensing to probe fainter systems, we are only probing the upper end of the predicted molecular gas mass distribution, suggesting that it will be challenging to detect non-lensed objects of similar gas masses.
Current usage metrics show cumulative count of Article Views (full-text article views including HTML views, PDF and ePub downloads, according to the available data) and Abstracts Views on Vision4Press platform.
Data correspond to usage on the plateform after 2015. The current usage metrics is available 48-96 hours after online publication and is updated daily on week days.
Initial download of the metrics may take a while.