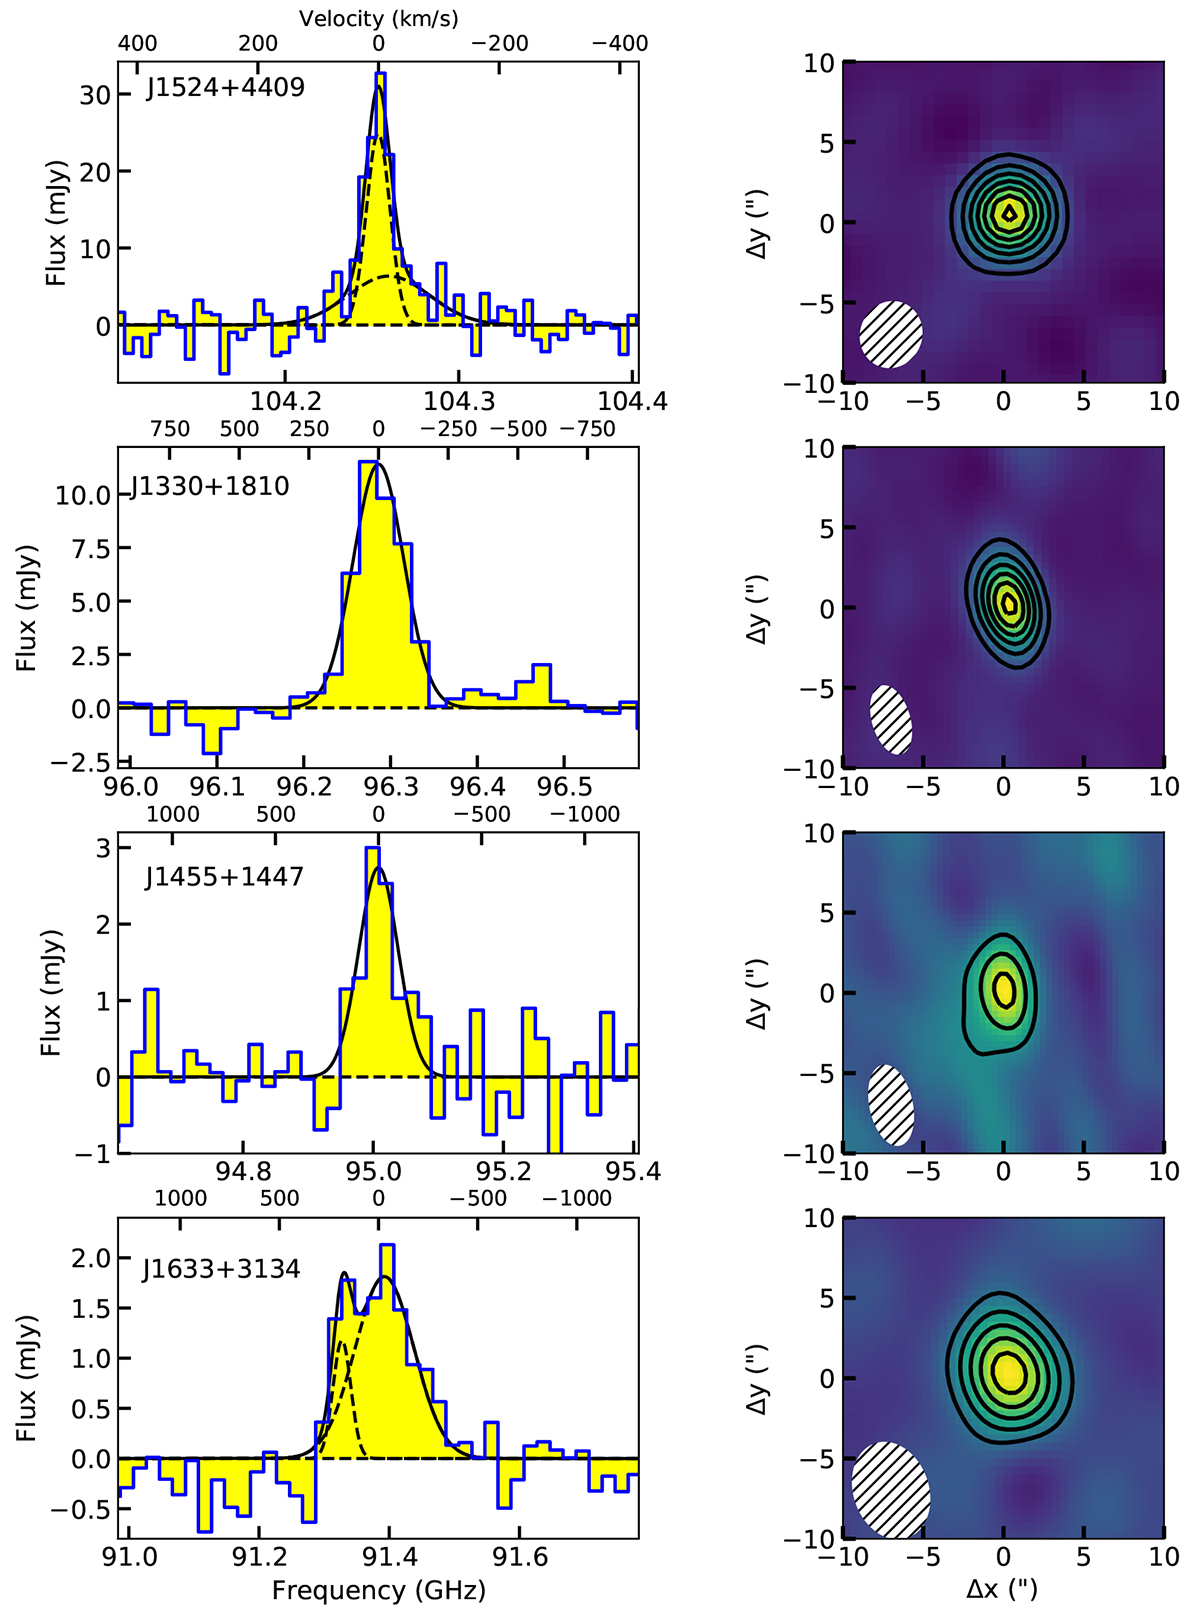
Fig. 1.
Download original image
CO(2–1) spectra and 0th moment maps for the detected QSOs. The black solid line indicates the best fit Gaussian model, and the reference velocity was determined based on the redshift derived from the Gaussian fit (LSRK frame). Contours in the 0th moment maps start at 4σ and increase in steps of 4σ for J1524+2209, J1330+1810, J0924+0219, and J1650+4251; contours for J1455+1447, J1633+3134, and J0806+2006 start at 2σ and increase in steps of 2σ. We have used the AIC criterion to determine whether a single- or double–Gaussian fit is more appropriate for the profiles.
Current usage metrics show cumulative count of Article Views (full-text article views including HTML views, PDF and ePub downloads, according to the available data) and Abstracts Views on Vision4Press platform.
Data correspond to usage on the plateform after 2015. The current usage metrics is available 48-96 hours after online publication and is updated daily on week days.
Initial download of the metrics may take a while.