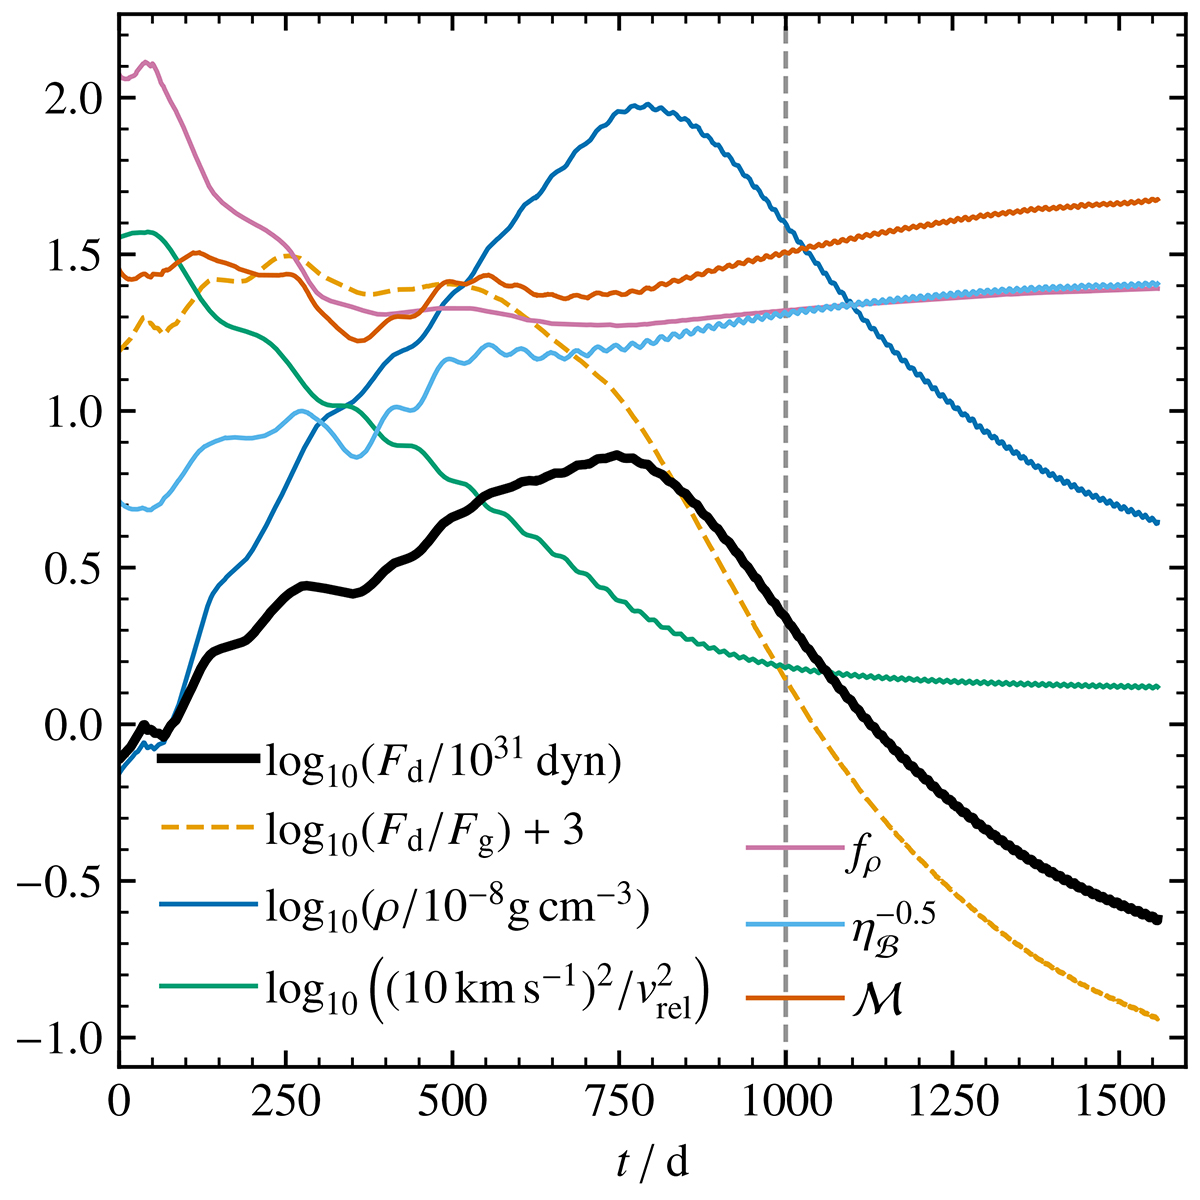
Fig. 8.
Download original image
Time evolution of the drag force and its components for q = 0.25, Cd = 0.23, and Ch = 4.0. The visualization of these quantities represents how each of them enters the drag force according to Eq. (5). The drag force is in the nonlinear regime, i.e., ℳ > 1.01 and ηℬ > 0.1, during the whole simulation. The ratio between the drag force and the gravitational force, Fg, is also shown. The vertical dashed gray line indicates the end of the dynamical plunge-in phase as determined by Eq. (22).
Current usage metrics show cumulative count of Article Views (full-text article views including HTML views, PDF and ePub downloads, according to the available data) and Abstracts Views on Vision4Press platform.
Data correspond to usage on the plateform after 2015. The current usage metrics is available 48-96 hours after online publication and is updated daily on week days.
Initial download of the metrics may take a while.