Fig. 5.
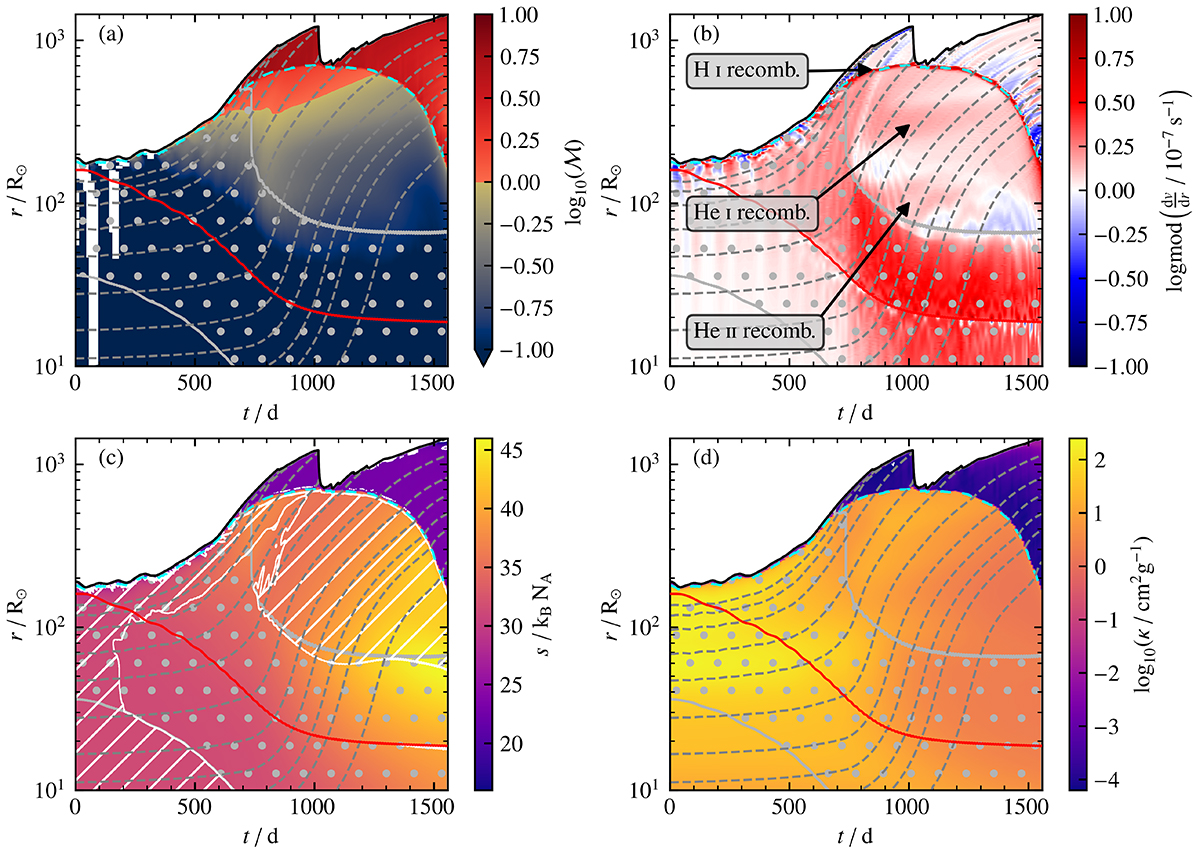
Download original image
Kippenhahn diagrams (similar to Fig. 4) of the simulation with q = 0.25, Cd = 0.23, and Ch = 4.0, showing the Mach number (ℳ= vr/cs) in panel a, velocity divergence (dv/dr) in panel b, specific entropy (s) in panel c, and opacity (κ) in panel d. The white hatched zones in panel c indicate convective mixing. For a better visualization of the velocity divergence, the log modulus transformation, logmod(x) = sgn(x)log10(|x|+1), is used (John & Draper 1980). The arrows in panel b roughly indicate the recombination zones of H I, He I, and He II (see also Figs. 4b–d).
Current usage metrics show cumulative count of Article Views (full-text article views including HTML views, PDF and ePub downloads, according to the available data) and Abstracts Views on Vision4Press platform.
Data correspond to usage on the plateform after 2015. The current usage metrics is available 48-96 hours after online publication and is updated daily on week days.
Initial download of the metrics may take a while.