Fig. 4.
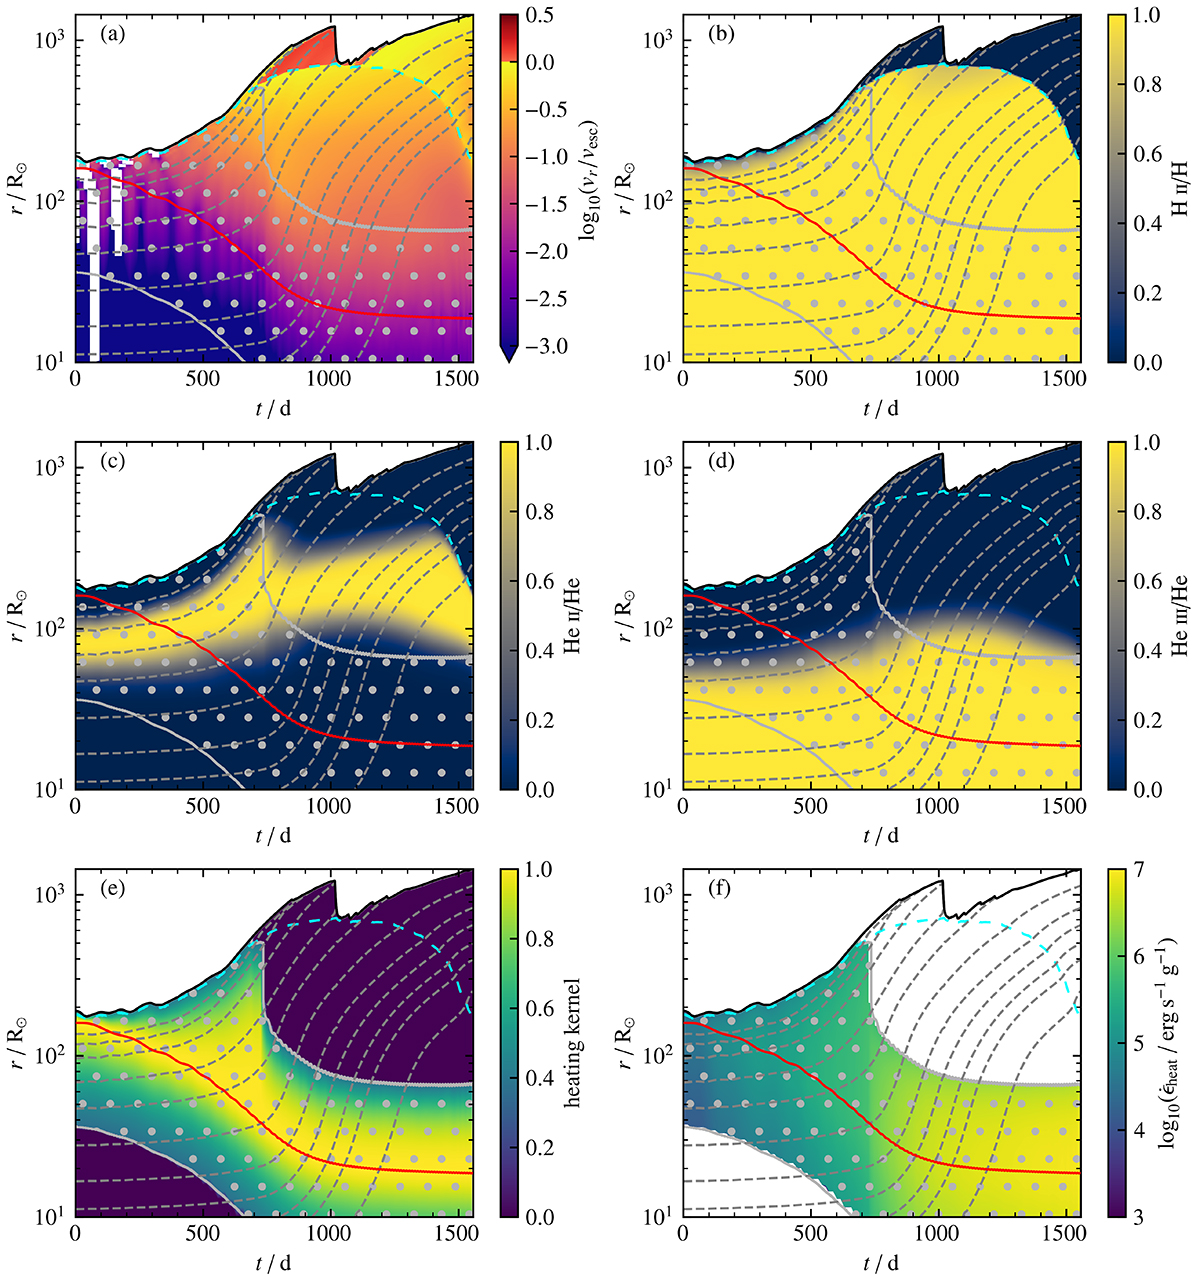
Download original image
Kippenhahn diagrams of the simulation with q = 0.25, Cd = 0.23, and Ch = 4.0. In panel a, the radial velocity is shown in terms of the local escape velocity; layers colored in red have a radial velocity higher than the local escape velocity. Panels b, c, and d show the ionization fractions of H II, HeII, and He III, respectively. The heating kernel as described in Eq. (15) is shown in panel e, and the specific heating rate in panel f. The red line indicates the orbital separation between the companion and the core of the giant star. The dotted gray region is heated during the CE simulation. The dashed cyan line shows Rτ = 10, which traces the hydrogen-recombination radius. The dashed gray lines represent envelope-mass fractions of 0.95, 0.9, 0.8, 0.6, 0.4, 0.2, 0.1, 0.06, 0.04, and 0.03 from the surface toward the center, and visualize the expansion of the envelope. The white patches in panel a show layers that have an inward (negative) radial velocity.
Current usage metrics show cumulative count of Article Views (full-text article views including HTML views, PDF and ePub downloads, according to the available data) and Abstracts Views on Vision4Press platform.
Data correspond to usage on the plateform after 2015. The current usage metrics is available 48-96 hours after online publication and is updated daily on week days.
Initial download of the metrics may take a while.