Fig. 2.
Download original image
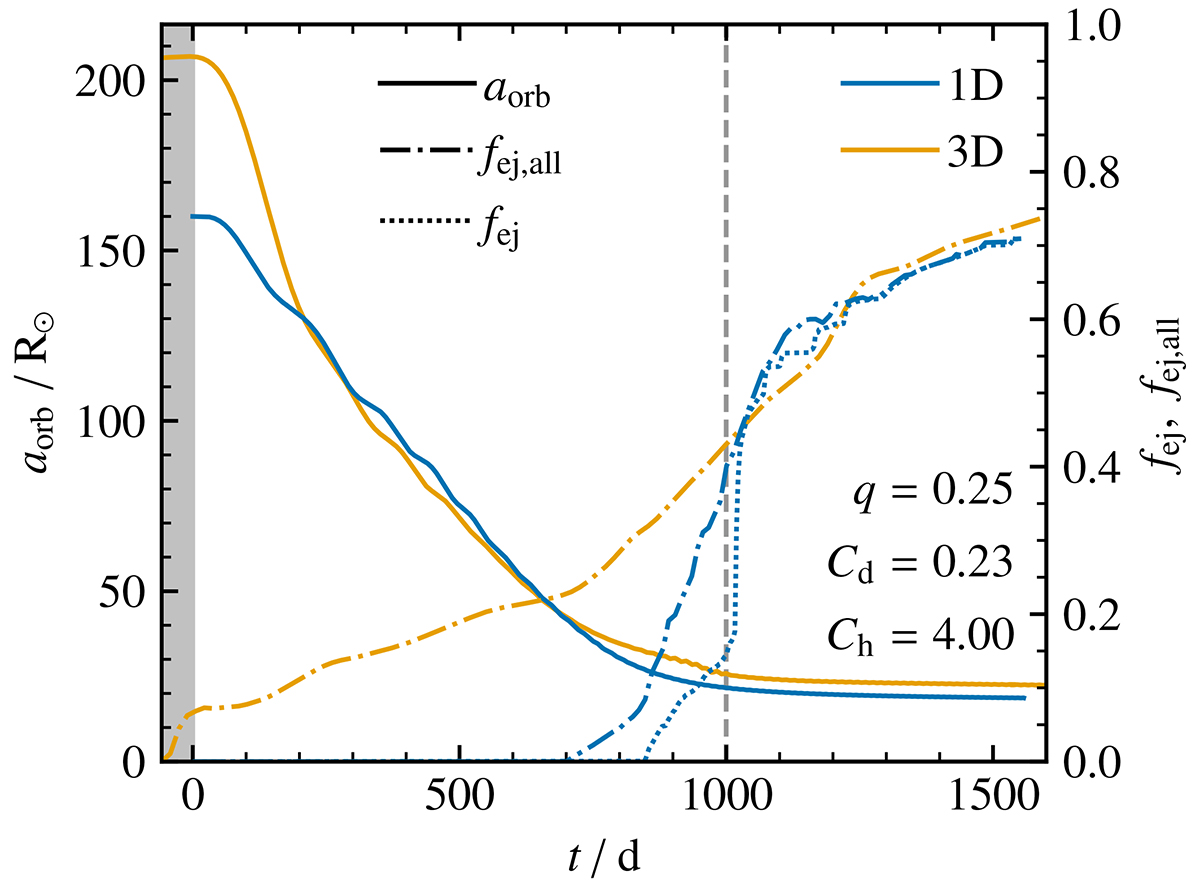
Best-fitting 1D CE simulation for q = 0.25 when comparing to the 3D CE simulation of Sand et al. (2020). Full lines show the orbital separation, and the dotted and dash-dotted lines show the mass fraction of ejected envelope fej and fej, all, respectively. The results of the 3D simulations are shown in orange, and the results from this work are shown in blue. The vertical dashed gray line indicates the end of the dynamical plunge-in phase as determined by Eq. (22). The 3D simulation results are all shifted by Δtmin = −58 d to compensate for the difference in the initial separation. The gray shaded region shows t < 0 d, for which we cannot compare the 1D simulation to the 3D simulation.
Current usage metrics show cumulative count of Article Views (full-text article views including HTML views, PDF and ePub downloads, according to the available data) and Abstracts Views on Vision4Press platform.
Data correspond to usage on the plateform after 2015. The current usage metrics is available 48-96 hours after online publication and is updated daily on week days.
Initial download of the metrics may take a while.