Fig. 3
Download original image
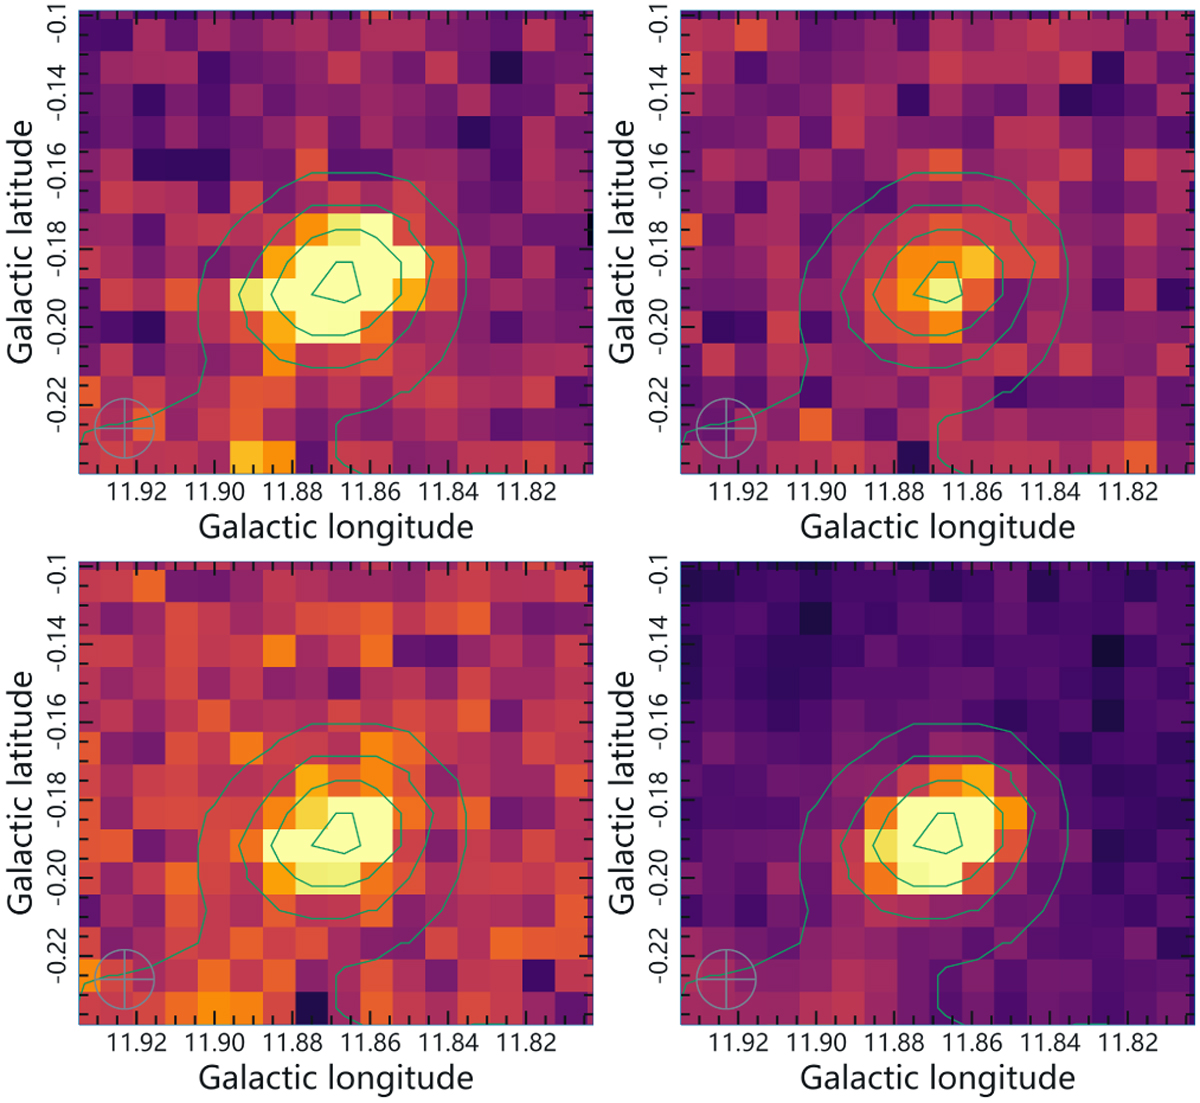
Examples of 13CO clumps having corresponding entities in C18O. The upper and lower subplots on the left illustrate the velocity channel map of 13CO clumps at −5.6 km s−1 and the integrated map spanning the velocity range of −7.3 to −4.5 km s−1, respectively. The two subplots on the right depict the corresponding results for C18O.
Current usage metrics show cumulative count of Article Views (full-text article views including HTML views, PDF and ePub downloads, according to the available data) and Abstracts Views on Vision4Press platform.
Data correspond to usage on the plateform after 2015. The current usage metrics is available 48-96 hours after online publication and is updated daily on week days.
Initial download of the metrics may take a while.