Open Access
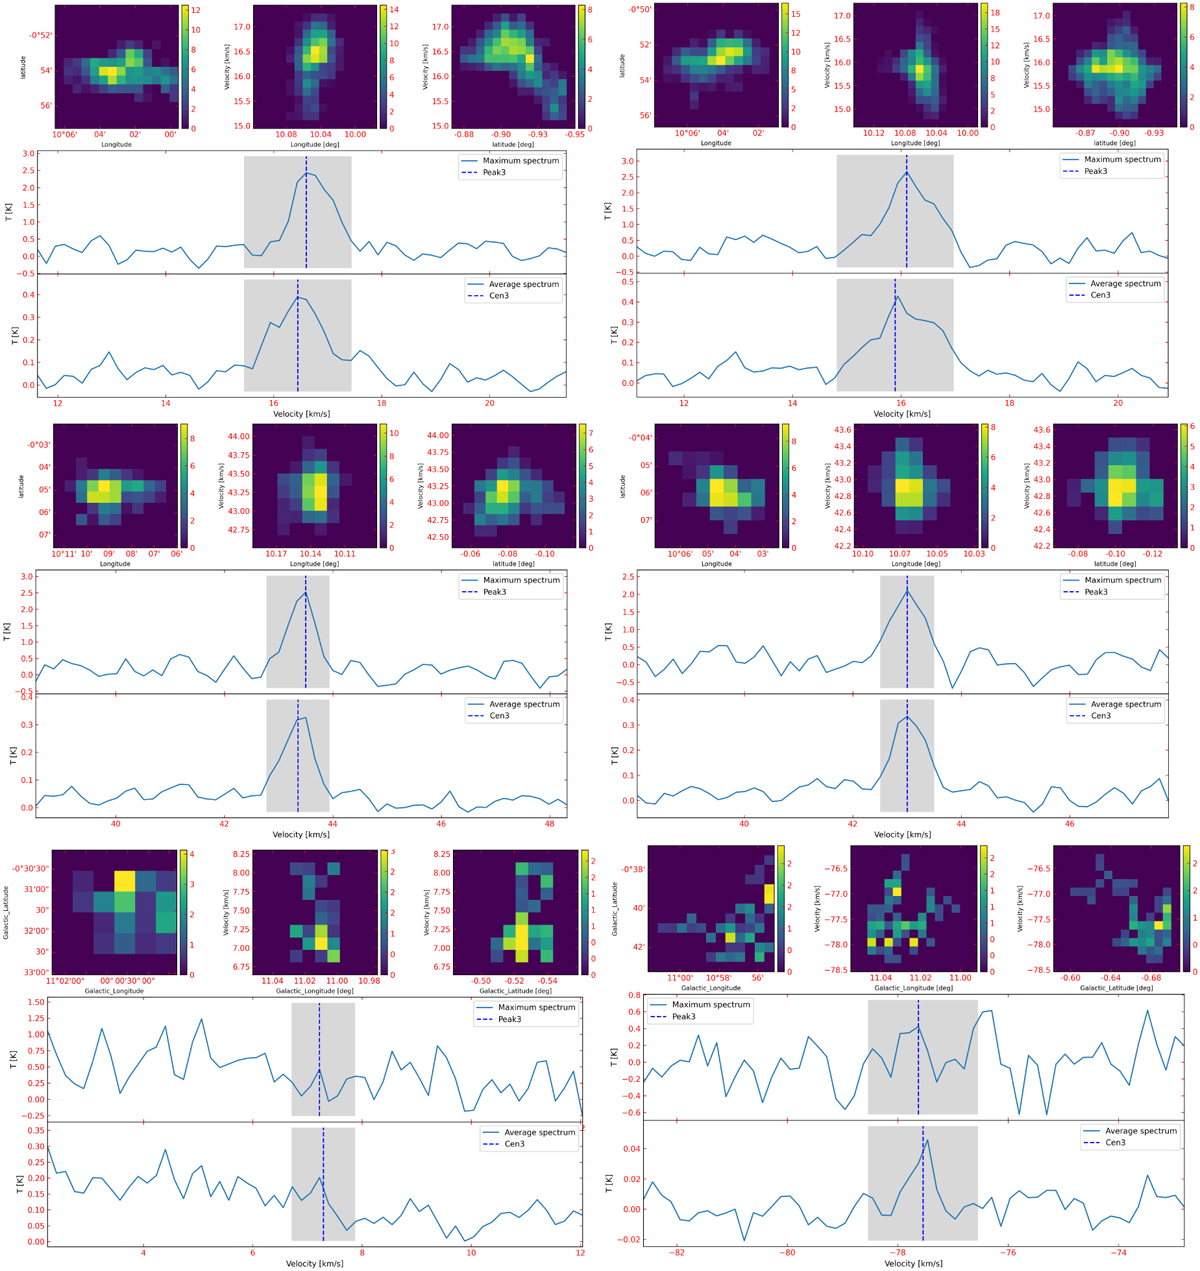
Fig. A.1
Download original image
Information on the molecular clump. The top three subplots offer the l − b, l – v, and b – v map integrations in three directions for a clump, while the middle and bottom panels of the figure show the peak spectrum and average spectrum of the clump, respectively.
Current usage metrics show cumulative count of Article Views (full-text article views including HTML views, PDF and ePub downloads, according to the available data) and Abstracts Views on Vision4Press platform.
Data correspond to usage on the plateform after 2015. The current usage metrics is available 48-96 hours after online publication and is updated daily on week days.
Initial download of the metrics may take a while.