Fig. 5
Download original image
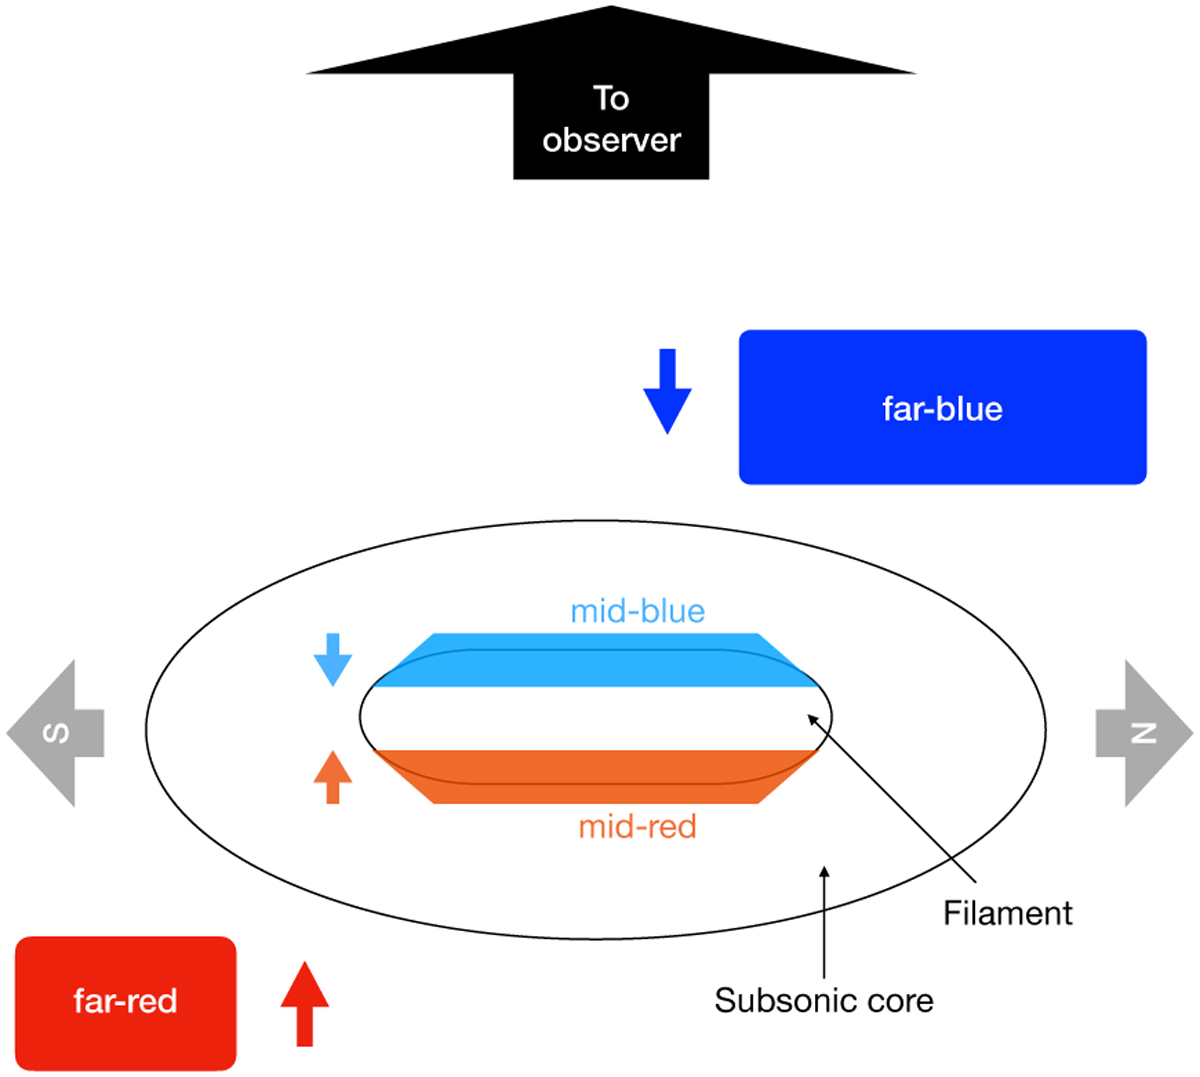
Schematic showing the spatial distribution of the different components in the line of sight. The coloured arrows show the direction of the velocity of the corresponding component. The ellipses represent the core and a filament inside the core, as indicated. The grey arrows indicate the north and south directions in the maps presented in this work.
Current usage metrics show cumulative count of Article Views (full-text article views including HTML views, PDF and ePub downloads, according to the available data) and Abstracts Views on Vision4Press platform.
Data correspond to usage on the plateform after 2015. The current usage metrics is available 48-96 hours after online publication and is updated daily on week days.
Initial download of the metrics may take a while.