Open Access
Fig. A.1
Download original image
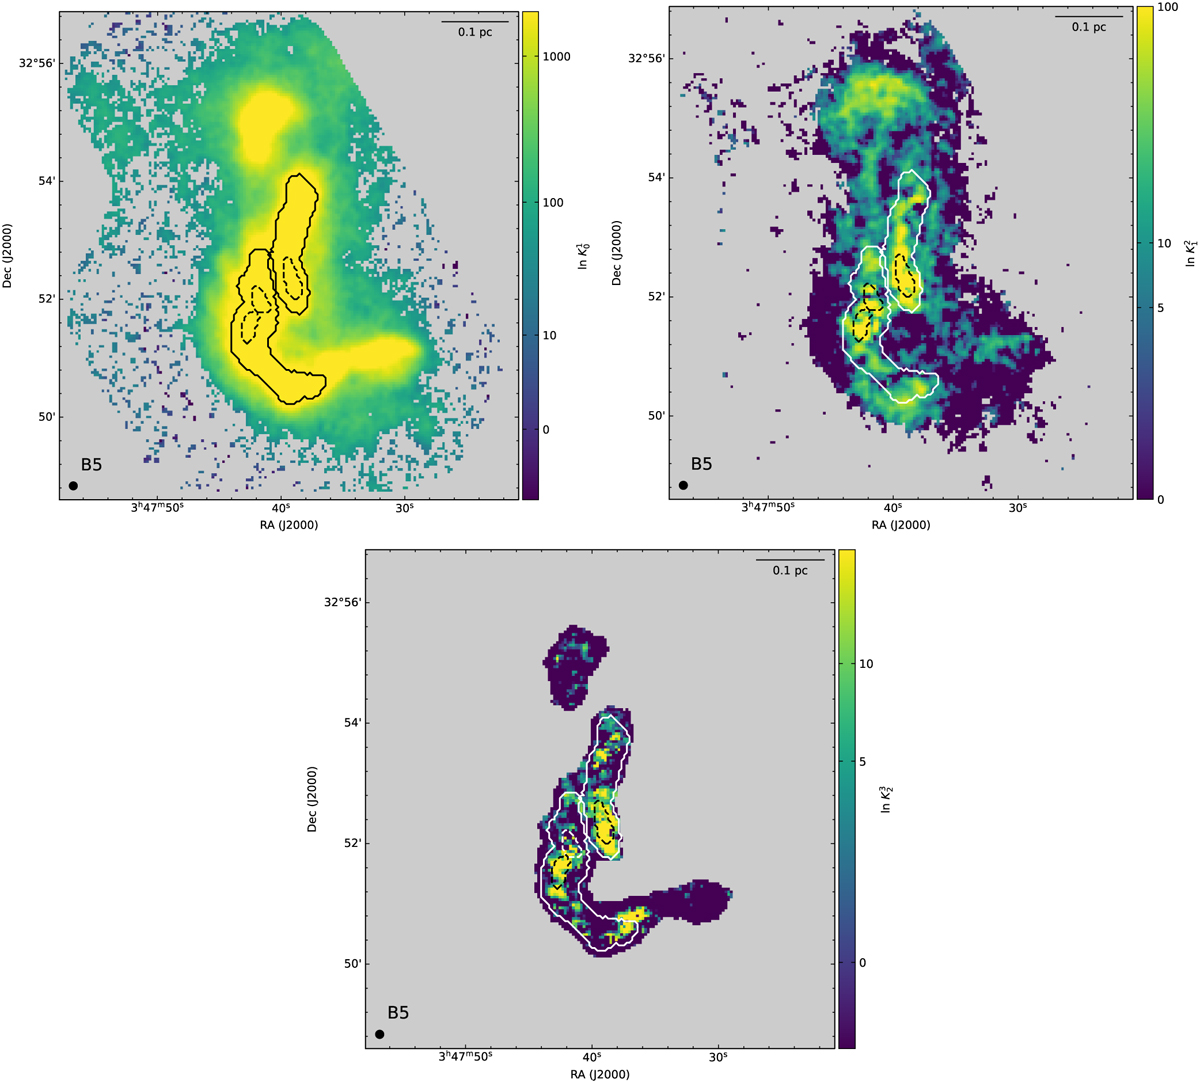
Maps of the Bayes factors, ![]() (top left),
(top left), ![]() (top right), and
(top right), and ![]() (bottom). The black-solid or white-solid contours show the two filaments and black-dashed or white-dashed contours show the three condensations in B5, respectively. The scale-bar and beam size are shown in the top-right and bottom-left corners, respectively.
(bottom). The black-solid or white-solid contours show the two filaments and black-dashed or white-dashed contours show the three condensations in B5, respectively. The scale-bar and beam size are shown in the top-right and bottom-left corners, respectively.
Current usage metrics show cumulative count of Article Views (full-text article views including HTML views, PDF and ePub downloads, according to the available data) and Abstracts Views on Vision4Press platform.
Data correspond to usage on the plateform after 2015. The current usage metrics is available 48-96 hours after online publication and is updated daily on week days.
Initial download of the metrics may take a while.