Open Access
Fig. 4.
Download original image
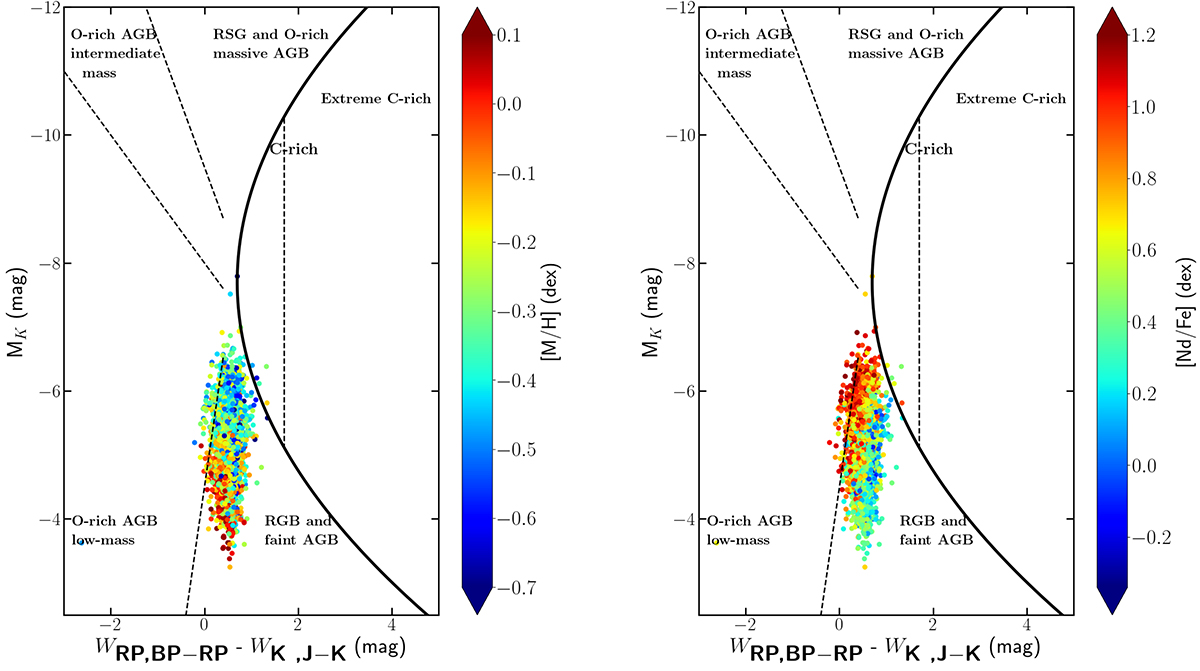
Gaia-2MASS diagram for the Nd AGB sample colour-coded with metallicity (left panel) and Nd abundance (right panel). The curved line delineates the theoretical limit between O-rich (left-side) and C-rich AGB stars (right-side). The dashed lines separate sub-groups of stars as indicated in the figure.
Current usage metrics show cumulative count of Article Views (full-text article views including HTML views, PDF and ePub downloads, according to the available data) and Abstracts Views on Vision4Press platform.
Data correspond to usage on the plateform after 2015. The current usage metrics is available 48-96 hours after online publication and is updated daily on week days.
Initial download of the metrics may take a while.