Open Access
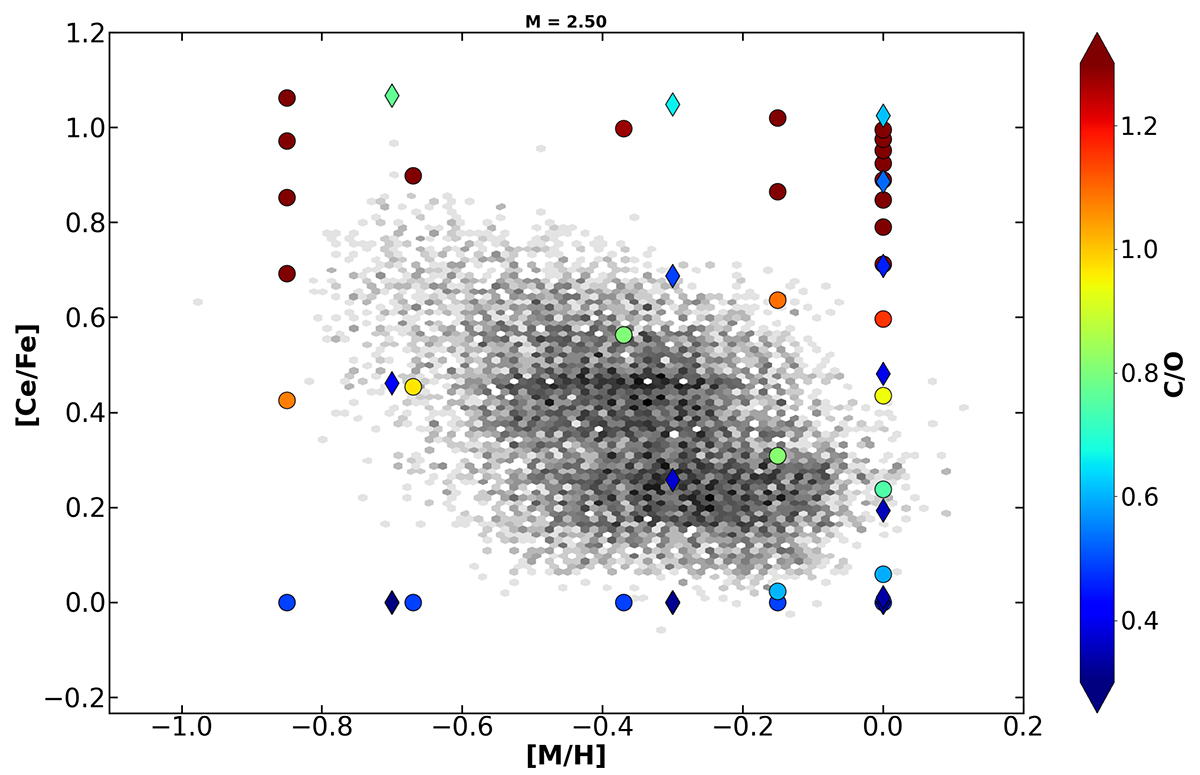
Fig. 10.
Download original image
Cerium AGB sample colour-coded by stellar counts. Filled diamonds (Monash models) and circles (FRUITY ones) correspond to the [Ce/Fe] predicted after each TDU, colour-coded by the C/O ratio. The AGB mass considered here is 2.50 M⊙.
Current usage metrics show cumulative count of Article Views (full-text article views including HTML views, PDF and ePub downloads, according to the available data) and Abstracts Views on Vision4Press platform.
Data correspond to usage on the plateform after 2015. The current usage metrics is available 48-96 hours after online publication and is updated daily on week days.
Initial download of the metrics may take a while.