Fig. 7.
Download original image
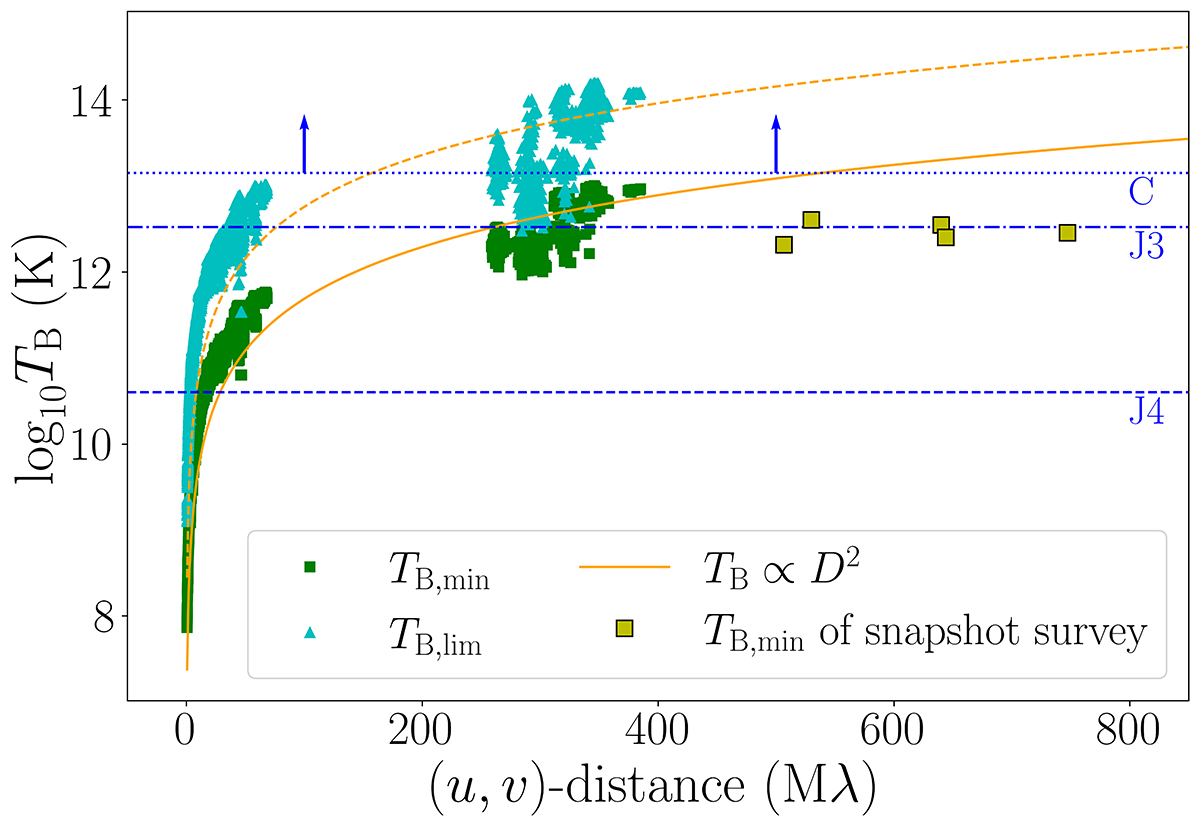
The brightness temperature as a function of the (u, v)-distance, D. The green, square shows the minimum TB and the cyan, triangle shows the limiting TB. The yellow, square shows the TB, min from five RadioAstron snapshot survey sessions close to our observation. The blue, horizontal lines show the TB at model components C (dotted), J3 (dotted-broken), and J4 (broken). Note that a lower limit is reported for C, since its size is smaller than the resolution limit (see Sect. 3.2).
Current usage metrics show cumulative count of Article Views (full-text article views including HTML views, PDF and ePub downloads, according to the available data) and Abstracts Views on Vision4Press platform.
Data correspond to usage on the plateform after 2015. The current usage metrics is available 48-96 hours after online publication and is updated daily on week days.
Initial download of the metrics may take a while.