Fig. 5.
Download original image
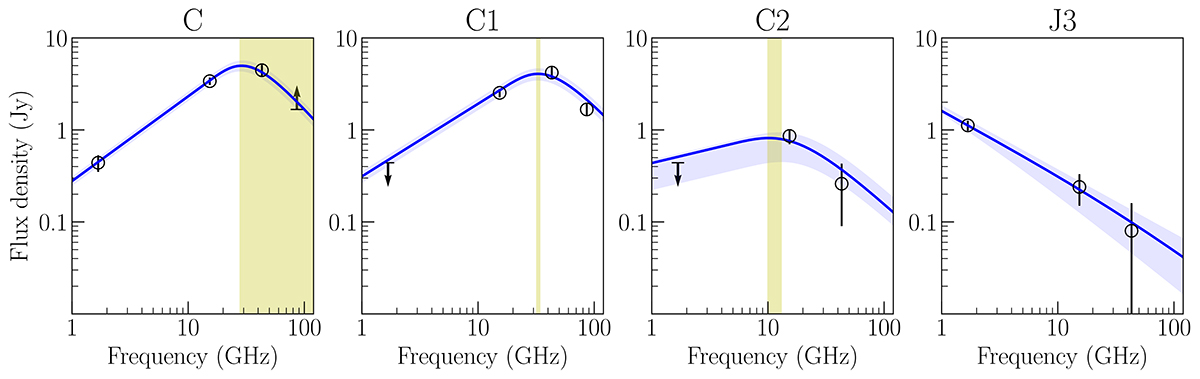
Spectra of model fitting components identified at 1.68, 15.35, 43.12, and 86.25 GHz: (from left to right) C, C1, C2, and J3. Flux densities are shown with black, circle points with uncertainty (see Table 2), and the blue, solid-line shows the fitting result assuming a SSA spectrum (see Sect. 3.1.3). Fitting errors, due to the flux density uncertainties, are presented with the blue, shaded area. The derived SSA turnover frequencies in C, C1, and C2 are shown with the yellow, shaded area.
Current usage metrics show cumulative count of Article Views (full-text article views including HTML views, PDF and ePub downloads, according to the available data) and Abstracts Views on Vision4Press platform.
Data correspond to usage on the plateform after 2015. The current usage metrics is available 48-96 hours after online publication and is updated daily on week days.
Initial download of the metrics may take a while.