Fig. 4.
Download original image
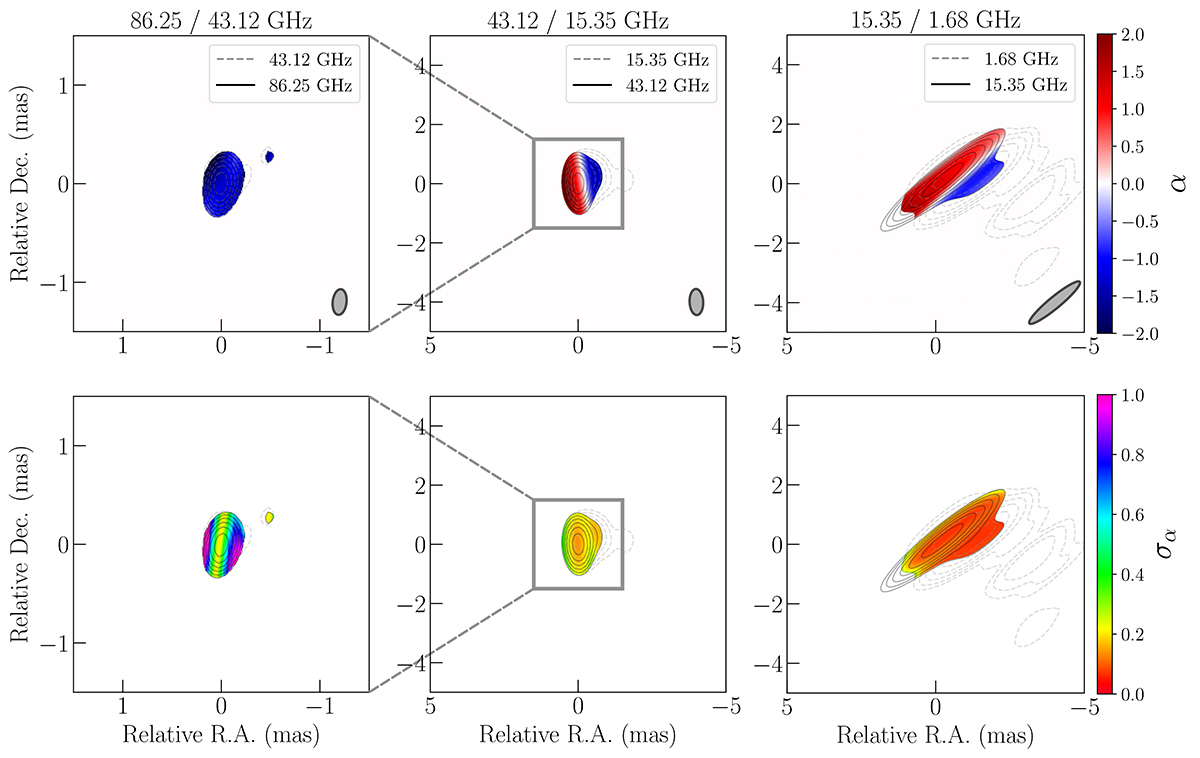
Spectral index map (top) and corresponding error map (bottom) at three frequencies pairs: 43.12−86.25 GHz (left), 15.35−43.12 GHz (middle), and 1.68−15.35 GHz (right). The color scale indicates the spectral index, α, and its error, σα, as shown at right of top and bottom panels, respectively. The contours of the source structure at each frequency are shown in each panel with gray, broken line for the lower frequency and black, solid line for the higher one. The contours are set to 2, 4, 8, 16, 32, 64% of the peak intensity. Note that the relative position of each image has been aligned according to cross correlation of core-masked images, as described in Sect. 3.1.
Current usage metrics show cumulative count of Article Views (full-text article views including HTML views, PDF and ePub downloads, according to the available data) and Abstracts Views on Vision4Press platform.
Data correspond to usage on the plateform after 2015. The current usage metrics is available 48-96 hours after online publication and is updated daily on week days.
Initial download of the metrics may take a while.