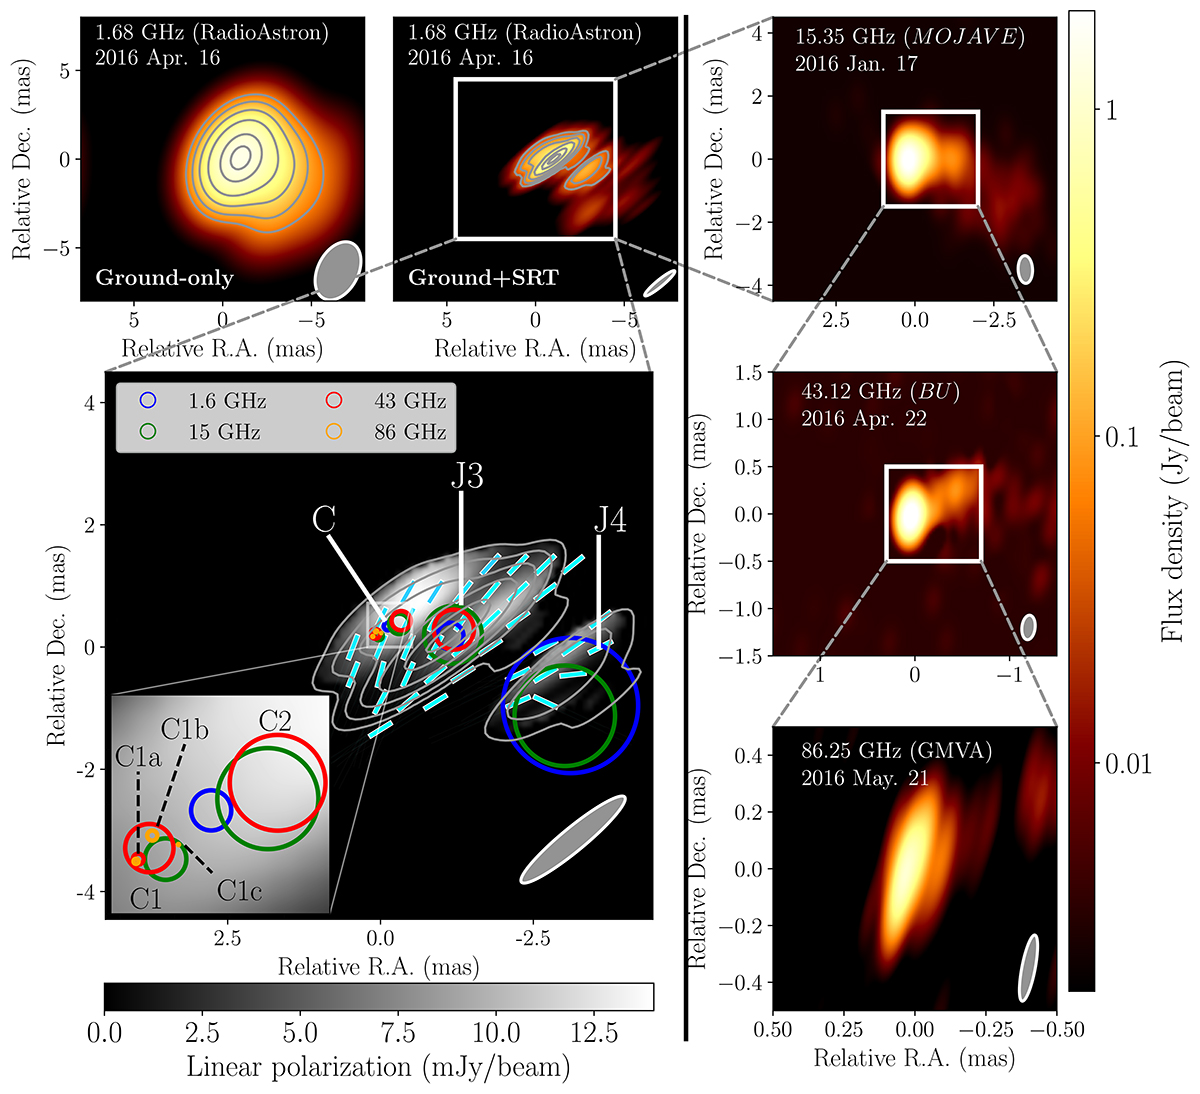
Fig. 3.
Download original image
Left: Stokes I images of OJ 287 at 1.68 GHz with a nominal resolution of ground-array only and ground+SRT (top). Bottom panel shows the ground+SRT image with total intensity (contour), model fitting results (colored circles), linear polarization (gray color), and EVPA (ticks). Note that the total intensity contours are set to 4, 8, 16, 32, 64, 90% of the peak intensity. Reliable linear polarization are obtained at where the total intensity is larger than 10σ of the root-mean-squared flux density of residual image. Right: The higher frequency images are shown for comparison: 15.35 GHz image from MOJAVE project (top), 43.12 GHz image from VLBA-BU-BLAZAR project (middle), and 86.25 GHz image from Lico et al. (2022). The field-of-view of image gets smaller at higher frequency which corresponds to the white box in the panels of lower frequency. The restoring beam is shown at the bottom-right corner of each panel. The color scale is in Jy per beam for total intensity images, and in milli-Jy per beam for linear polarization.
Current usage metrics show cumulative count of Article Views (full-text article views including HTML views, PDF and ePub downloads, according to the available data) and Abstracts Views on Vision4Press platform.
Data correspond to usage on the plateform after 2015. The current usage metrics is available 48-96 hours after online publication and is updated daily on week days.
Initial download of the metrics may take a while.