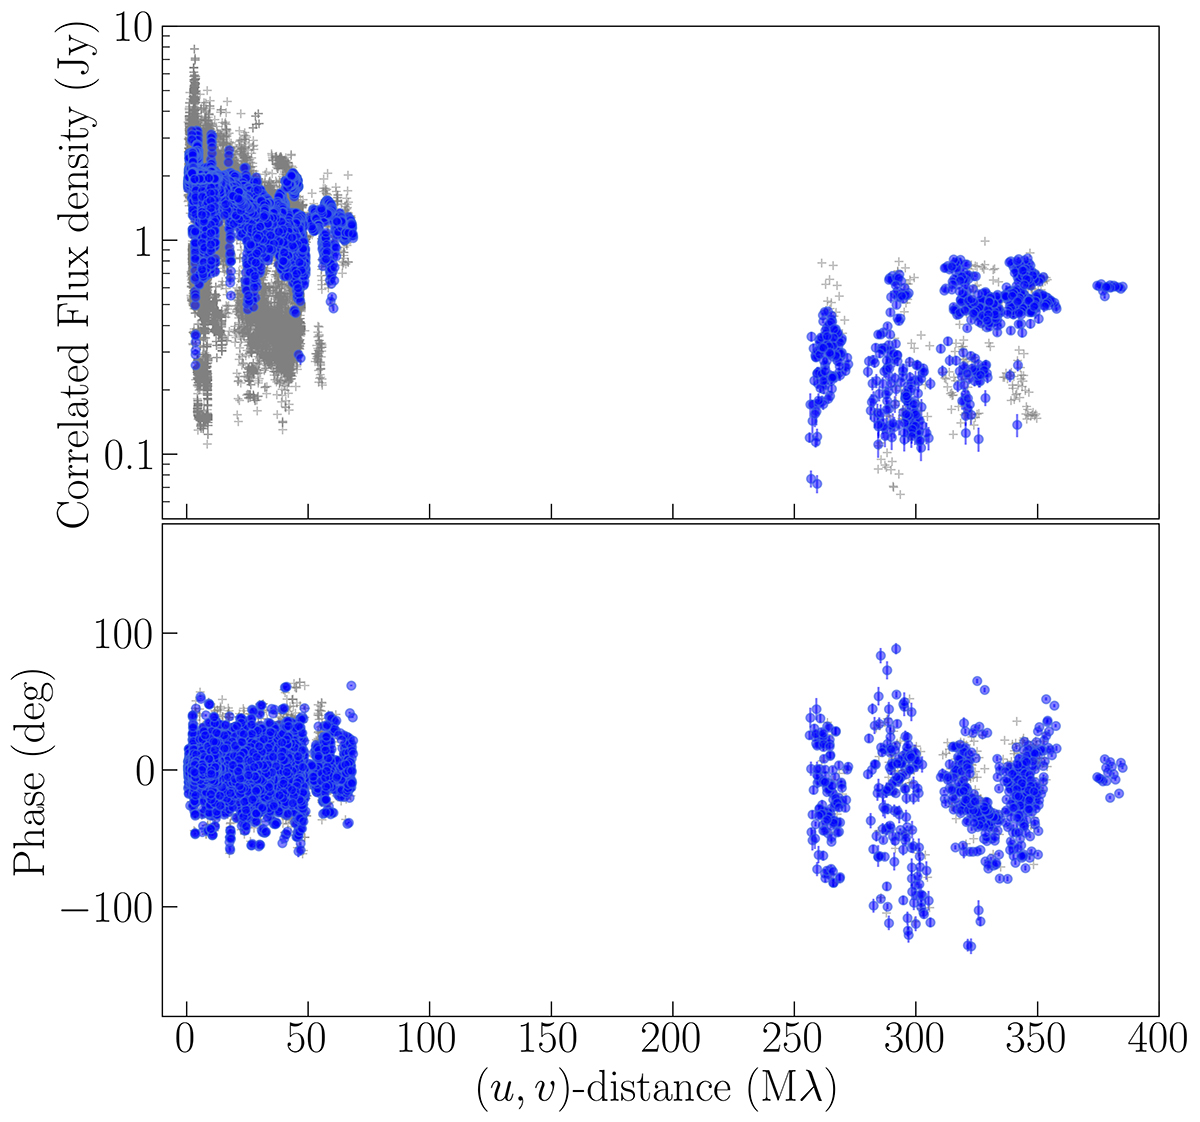
Fig. 2.
Download original image
The visibility amplitudes (upper) and phases (lower), as a function of the (u, v)-distance. Each point has been averaged with 5 min interval. Note that only the blue, circle data points are used for CLEAN imaging, and all data including the gray, cross points are self-calibrated with the image (see Sect. 2).
Current usage metrics show cumulative count of Article Views (full-text article views including HTML views, PDF and ePub downloads, according to the available data) and Abstracts Views on Vision4Press platform.
Data correspond to usage on the plateform after 2015. The current usage metrics is available 48-96 hours after online publication and is updated daily on week days.
Initial download of the metrics may take a while.