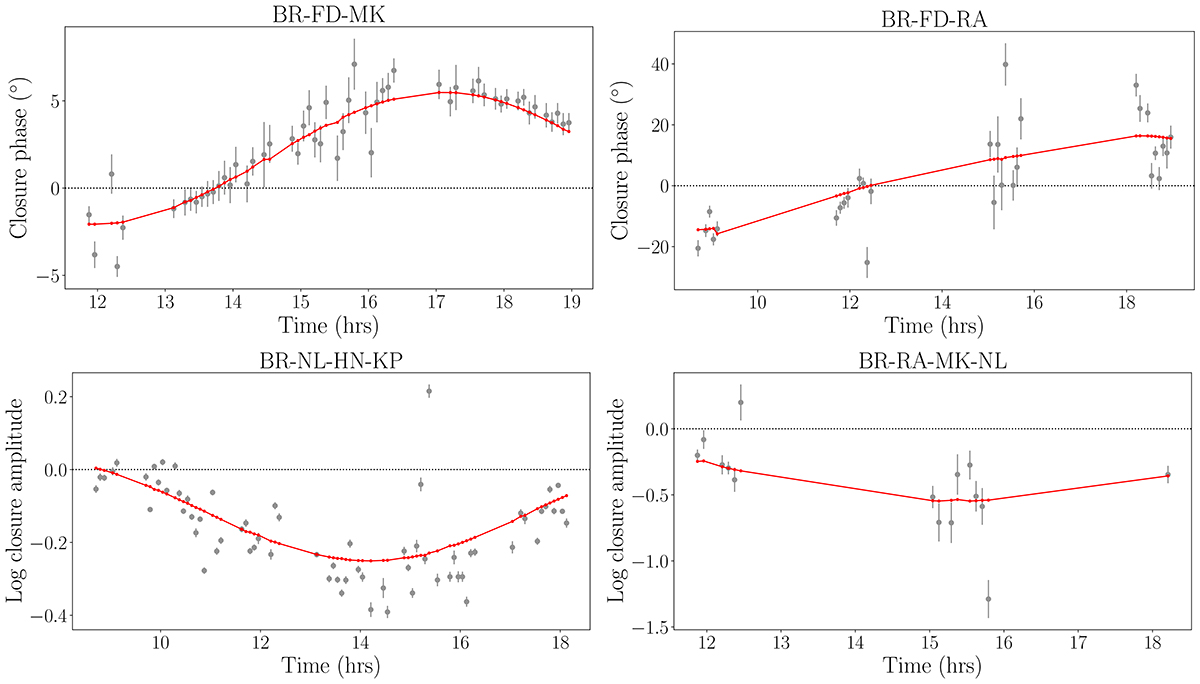
Fig. A.3.
Download original image
The closure phases (top) and log closure amplitudes (bottom), at the triangle/quadangle of ground array (left) and with the SRT (right). The stations consisting of each triangle and quadangle are shown at the top of each panel. Model from image (red, solid line) well fits the data (gray, circle).
Current usage metrics show cumulative count of Article Views (full-text article views including HTML views, PDF and ePub downloads, according to the available data) and Abstracts Views on Vision4Press platform.
Data correspond to usage on the plateform after 2015. The current usage metrics is available 48-96 hours after online publication and is updated daily on week days.
Initial download of the metrics may take a while.