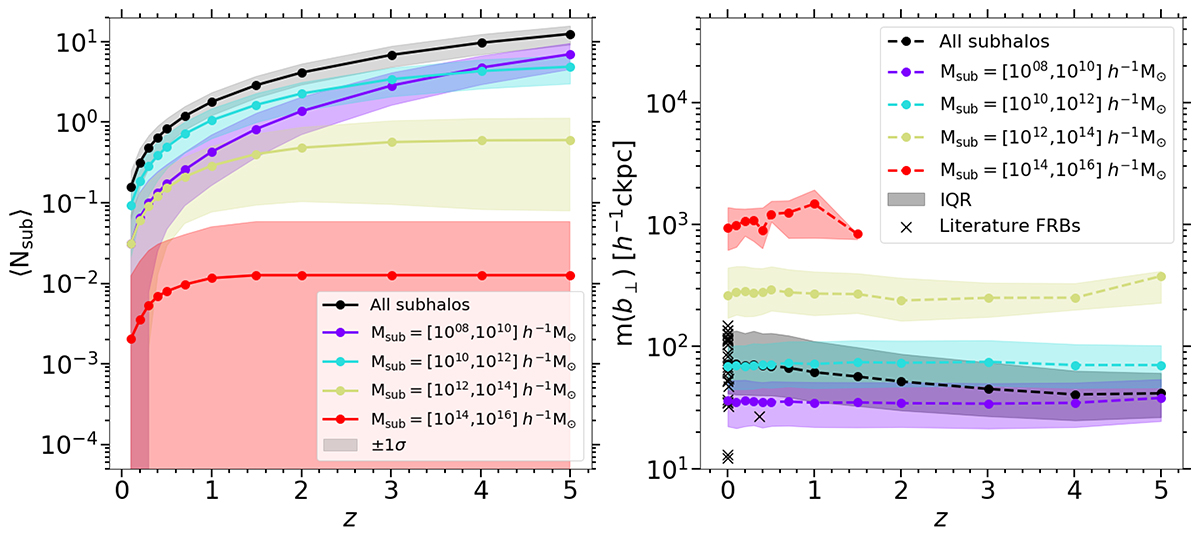
Fig. 9.
Download original image
Collapsed structures traversed with redshift. Left panel: statistics (mean, standard deviation) describing the average number of subhalos traversed by FRB sightlines out to given redshifts within TNG300-1. Black lines and grey shaded regions describe the total number of subhalos traversed; coloured lines and shaded regions describe the number of subhalos when binned by mass according to the mass bins of Fig. 8. Right panel: statistics (median, interquartile range) describing the average impact parameters between our sightlines and these structures within each snapshot. Overplotted crosses are the impact parameters between observed FRBs and galaxies as calculated by Connor & Ravi (2022), Connor et al. (2020), and Prochaska et al. (2019a).
Current usage metrics show cumulative count of Article Views (full-text article views including HTML views, PDF and ePub downloads, according to the available data) and Abstracts Views on Vision4Press platform.
Data correspond to usage on the plateform after 2015. The current usage metrics is available 48-96 hours after online publication and is updated daily on week days.
Initial download of the metrics may take a while.