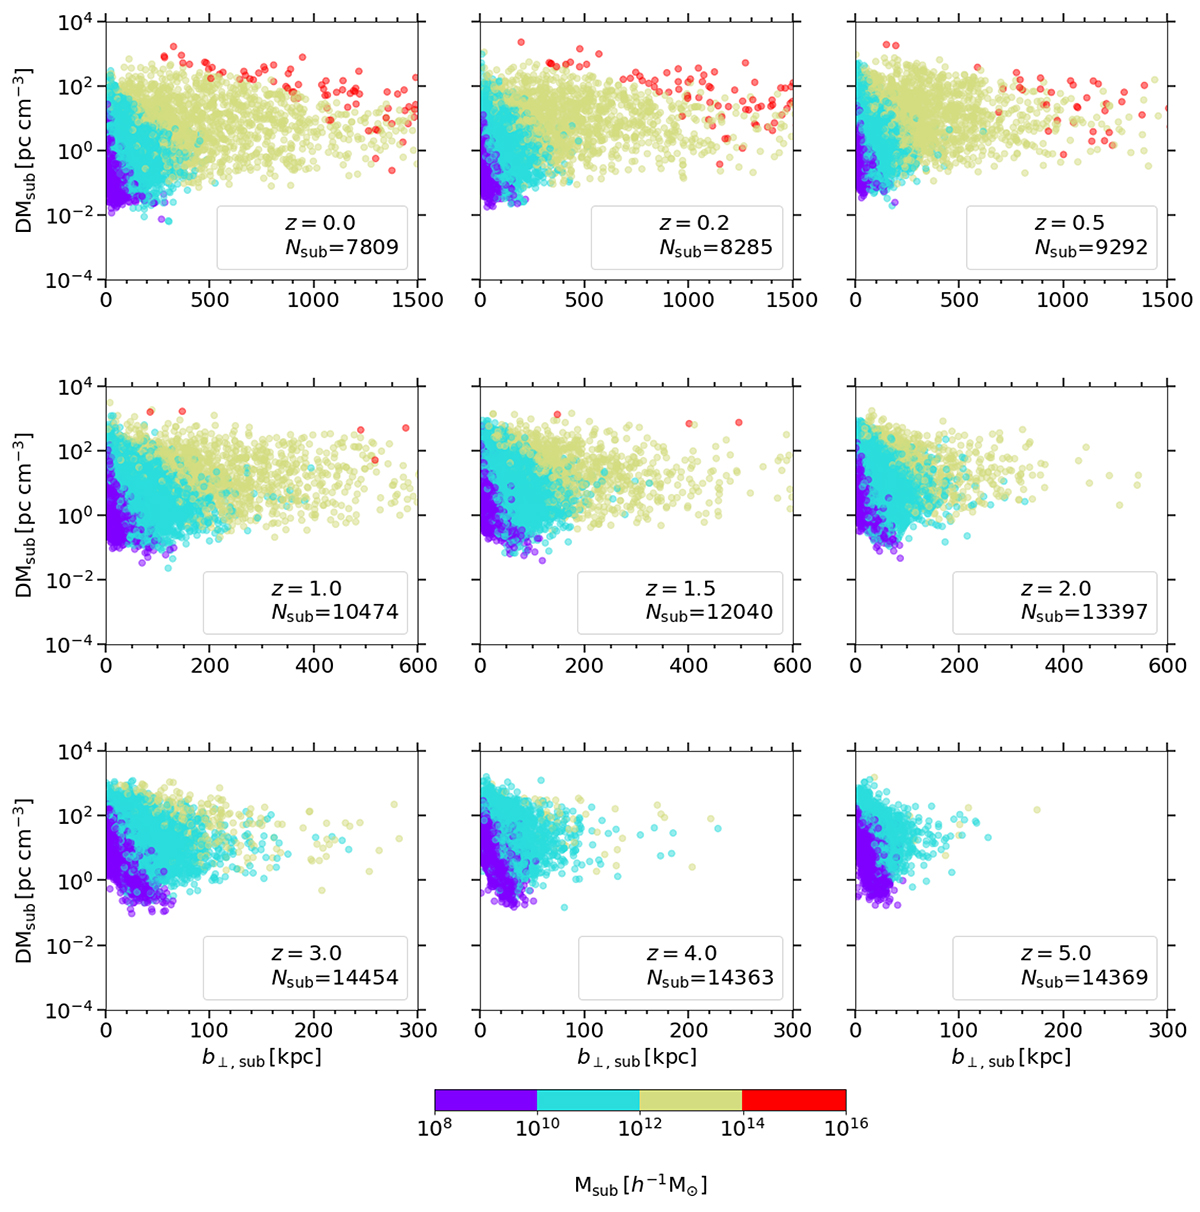
Fig. 8.
Download original image
Collapsed structures traversed by our segments. Each panel: scatter points indicating the distributions in the impact parameter (b⊥, sub)–accumulated dispersion measure (DMsub) parameter space for any subhalos considered traversed by our segments, in the snapshot of redshift z described in the legend. Each scatter point colour is determined using its subhalo mass Msub according to the mass bin ranges described by the colour bar. The total number of subhalos Nsub traversed by all segments within a given snapshot is provided in the legend.
Current usage metrics show cumulative count of Article Views (full-text article views including HTML views, PDF and ePub downloads, according to the available data) and Abstracts Views on Vision4Press platform.
Data correspond to usage on the plateform after 2015. The current usage metrics is available 48-96 hours after online publication and is updated daily on week days.
Initial download of the metrics may take a while.